Scottsdale Report: Residential Real Estate Trends for April 2017. Estimated months of supply for single family homes and more!

This report is on Scottsdale sales and new listing trends for single family, apartment style, townhouse and patio homes.

The data was compiled from the Arizona Regional Multiple Listing Services, Inc. (ARMLS).

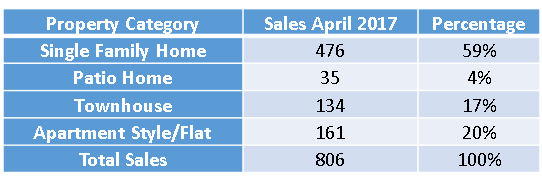
In April, of the four residential categories, single family homes had the most sales at 476 or 59% of all sales.  Second was Apartment Style / Flat homes with 161 sales.

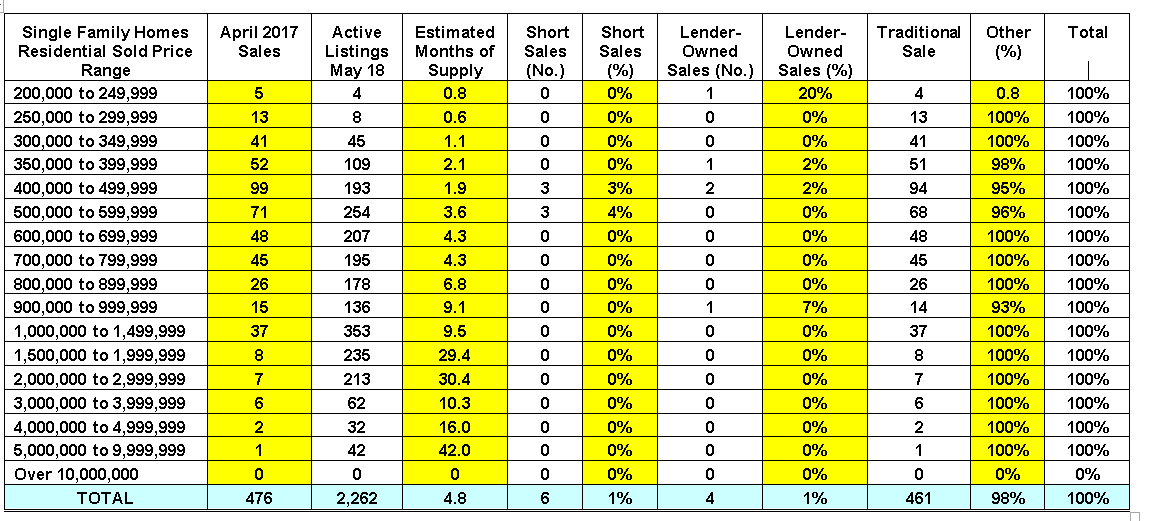
Single Family Homes Estimated Months of Supply by Price Range

As can be seen in the table, homes in the lower price ranges generally have lower estimated months of supply.  Generally when there is a four month of supply or less it is considered a seller’s market.  Out of the 476 sales only ten were either a short sale or lender-owned sale.

April 2017

As can be seen, sales in three of the four categories were up this April over last April.  Townhouse sales had the greatest increase at 34%, while single family sales were down 4%.  Even though single family homes were down this April compared to last April, single family home sales are up ten percent for the first four months of 2017 (see the table below in the section Sales and New Listing Trends for the First Four Months of 2017).  

How did new monthly listings for the four categories compare in April 2017 to April 2016?

There were less new monthly listings in each of the four residential categories this April compared to last April.

Sales and New Listing Trends for the First Four Months of 2017

Below enter your email address to subscribe to this blog and receive notifications of new updates to The Wilcox Report by email.

Contact me to open your next escrow with our Scottsdale office located at 8520 E. Shea Blvd., Suite 115, 85260.

Fletcher R. Wilcox is the author of The Wilcox Report and Vice President of Business Development for Grand Canyon Title. His market analysis has been referenced in the Wall Street Journal, Bloomberg News, HousingWire.com and National Mortgage News. He served on one of Arizona Association of Realtor’s 2017 Residential Resale Contract subcommittees. He may be reached at FWilcox@GCTA.com  or by phone at 602-648-1230.

Recent media appearances

May 17, 2017 in the Phoenix Business Journal  http://www.bizjournals.com/phoenix/news/2017/05/11/existing-home-sales-highest-since-2006-up-18-over.html

May 12, 2017 KTAR    https://ktar.com/story/1570668/maricopa-county-home-sales-up-18-percent-near-prerecession-numbers/

Television interviews

My interview with Gerri Willis on the Fox Business News Network

Interview with Jim Belfiore on Square Off Arizona. Topic: The President and Housing.

Interview on Horizon on housing market.

Who will be the top real agent, broker and more!

Old Town Scottsdale 2017 Friday Night Industry Party

Awards will be for

  • Residential real estate agent of the year
  • Residential real estate broker of the year
  • Residential rookie agent of the year
  • Residential team of the year
  • Commercial managing principal of the year
  • Commercial real estate broker of the year
  • Home inspector of the year
  • Certified appraiser of the year
  • Escrow officer of the year
  • Title sales representative of the year
  • Mortgage loan originator of the year

What time of the year are there the most new listings and the most real estate sales? A review of the numbers in Greater Phoenix.

 When are Real Estate Agents the Busiest?

By

Fletcher R. Wilcox

Grand Canyon Title Agency

Real estate agents make their commissions as listing agents and as selling agents. So at what times of the year are agents the busiest listing seller’s homes and closing on sales with buyers? What times of the year are listings and sales the slowest? Does real estate activity really slow down in the hot summer months?

So, what I did was research the number of new listings and sales for existing single family homes in Maricopa County, Arizona.  I broke down the years 2014, 2015 and the first half of 2016 into quarters. The data is from the Arizona Multiple Listing Services, Inc. (ARMLS).

The Findings

image001

New Listings: Which Quarter Had the Most and the Least?

In both 2014, 2015 and in the first half of 2016 we saw the same pattern for new listings. The first quarter, the winter quarter, had the most new listings. Then like a stair step, the number of new listings declines in each of the following quarters with the fourth quarter having considerable less new listings than the first quarter. Then as the chart below shows, listings shoot up again in the first quarter of the New Year.

More New Listings and Sales in First-Half of 2016 Than in Either 2014 or 2015

When comparing the number of new listings in the first two quarters of 2016 there were 2,792 more new listings than 2015 and 1,280 than 2014. This increase in inventory along with job growth and population growth and boomerang buyers has fueled home ownership. There were 1,268 more sales in the first two quarters of 2016 than 2015 and a whopping 4,243 more sales than 2014.

image001


Sales

Sales: Which Quarter Had the Most and Least?

While the first quarter has the most new listings, the second quarter has the most sales. The chart below shows single family sales. In 2014, the quarter with the least number of sales was the first quarter. In 2015, it was a toss-up for the least number of sales between the first quarter and the fourth quarter. There were only thirty-six more closings in the fourth quarter over the first quarter. The second best quarter for sales has been the third quarter.

There are More Sales in the Hot Summer Months Than You Might Think

If we compare sales in the third quarter, the hot weather months of July, August and September, to the best quarter, the second quarter, we saw a decline in sales of 12% in both 2015 and 2014.

However, the third quarter has been the second best quarter for sales. In 2015, third quarter sales were 18% higher than in both the first and fourth quarters.

image002

Conclusions

In recent history, the first and second quarters of the year had the most new listings followed by the second and third quarters as the most sales. While real estate sales slow-down in the hot weather third quarter compared to the spring second quarter, the third quarter has been the number two quarter for most sales. While sales in the first and fourth quarters are the slowest, there is still lots of sales activity. Data shows sales in the first and fourth quarters range between 12,000 and 14,000. Look for sales in the fourth quarter of  2016 to be over 14,000 sales.

Fletcher Wilcox 2016 picture

Fletcher R. Wilcox is V.P. of Business Development and a Real Estate Analyst at Grand Canyon Title Agency.

He is author of www.TheWilcoxReport.com. His market analysis on residential real estate in Greater Phoenix has been mentioned in the Wall Street Journal, Bloomberg News, MarketWatch, HousingWire.com, National Mortgage News, Arizona Republic and the Phoenix Business Journal. He has been a guest speaker on local radio and both local and national TV.

He teaches real estate agents strategies in marketing and instructs real estate renewal classes in residential contract writing and Arizona title procedures.  Fletcher started snowboarding in 2006. He is not very good.

Fletcher may be reached at FWilcox@GCTA.com  602.648.1230


Arizona Real Estate: Why more Canadians may sell their U.S. Properties in 2016

This article was first published in the Arizona REALTOR® Voice on March 8, 2016.

by Fletcher R. Wilcox on March 9, 2016

Many Canadians own residential real estate in Arizona. They are especially attracted to the desert areas of Arizona during the winter when they can soak in the sun rather than shake off the snow.

Many got spectacular deals purchasing residential properties when prices were low and the Canadian dollar was close to being on par with the U.S. dollar.

Changes in the Canadian economy and dollar make it likely that there are now fewer Canadian buyers, but more sellers of their U.S. properties.  According to the Wall Street Journal on February 25, Canada’s economy is under pressure because of a drop in oil prices. In 2015, the Canadian-to-U.S. dollar average was at .75 cents compared to .97 cents in 2011.

Let’s look at a scenario as to why more Canadians may sell their U.S. properties this year than in recent years.

If a Canadian bought a house in the U.S. in 2011 and paid $150,000 USD, they would have paid close to $155,000 CAD.  In 2015, if that same property, because of appreciation, sold for $225,000 USD, a Canadian seller would receive $300,000 CAD, almost double what they paid in Canadian dollars in 2011. Quite a gain. So far in 2016, the Canadian dollar is even weaker against the U.S. dollar than last year.

USD v CAD exchange rate 2010-15

If a Canadian or if any foreigner, decides to sell their U.S. residential property, they should be aware of the Foreign Investment in Real Property Tax Act known as FIRPTA.

FIRPTA is the mandatory withholding of income tax on the disposition of U.S. real property interests by a foreign person(s) defined as a nonresident alien individual, a foreign corporation, a foreign partnership, trust or estate. According to the IRS, not only are sales under FIRPTA, but so are exchanges, gifts and transfers.

On February 17, the FIRPTA withholding tax rate increased up to 15% as demonstrated in the chart below:
FIRPTA demo chart

According to FIRPTA, what is the buyer’s responsibility? A buyer is solely responsible for the FIRPTA withholding tax from a seller.

When the seller is a foreign person? The IRS states:

“In most cases, the transferee/buyer is the withholding agent.  If you are the transferee/buyer you must find out if the transferor is a foreign person.  If the transferor is a foreign person and you fail to withhold, you may be held liable for the tax.”

To help make buyers and sellers aware of FIRPTA, Arizona REALTORS® has addressed it in the Seller’s Property Disclosure Statement (SPDS) and Residential Resale Real Estate Purchase Contract (Resale Contract).

Lines 13 and 14 in the SPDS read:
Is the legal owner(s) of the Property a foreign person or a non-resident alien pursuant to the Foreign Investment in Real Property Tax Act (FIRPTA)? Yes No. If yes, consult a tax advisor; mandatory withholding may apply.

Lines 135-138 in the Resale Contract read:
IRS and FIRPTA reporting: Seller agrees to comply with IRS reporting requirements. If applicable, Seller agrees to complete, sign, and deliver to Escrow Company a certificate indicating whether Seller is a foreign person or non-resident alien pursuant to the Foreign Investment in Real Property Tax Act (“FIRPTA”). Buyer and Seller acknowledge that if the Seller is a foreign person, the Buyer must withhold a tax of up to 15% of the purchase price, unless an exemption applies.

The seller in the Resale Contract agrees to comply with FIRPTA if they are a foreign person; if applicable, the buyer must withhold the tax. In the SPDS, the seller must indicate if they are a foreign person or non-resident alien; if they are, they should consult a tax advisor.

While different settlement agents may have different procedures, escrow officers are not equipped to give tax or legal advice concerning FIRPTA.

The IRS does not require the settlement agent to:

  • Determine a seller’s status as a foreign person
  • Decide how much FIRPTA tax should be withheld
  • Decide if the seller qualifies for an exemption, or
  • Complete FIRPTA forms

What then may a settlement agent do?

IF a buyer has determined that a seller owes FIRPTA tax, the escrow officer may assist them in collecting completed forms and withholding tax from the seller and buyer, and send the forms and taxes to the IRS on behalf of the seller and buyer.  (Remember, there is no duty by the escrow officer to complete FIRPTA documents.)

IF a seller applies for an IRS certificate exempting or reducing FIRPTA withholding tax prior to the transaction closing, it is likely that the certificate from the IRS will not be received until post-closing.  A settlement agent may agree to hold FIRPTA funds post-closing and send the funds to the IRS if certain conditions are met prior to the closing.  If the required conditions are met, then both the buyer and seller will have to sign post-closing holdback instructions.

IF the requirements of a post-closing holdback are not met, the seller and buyer will have one of two options.  The settlement agent may collect the proper forms and send in the withholding tax at the time of the closing.  Or the seller and buyer mutually agree in writing that the FIRPTA funds may be transferred to an attorney or CPA’s trust account.  The attorney or CPA will be responsible for the FIRPTA withholding amount.

Tips
If there is a FIRPTA withholding, both the seller and buyer will need either a social security number or a valid U.S. Individual Taxpayer Identification Number (ITIN) in order to process FIRPTA documents. If someone is not eligible for a social security number, they must apply for an ITIN.

Because of the length of time it may take to receive either a social security number or ITIN, it is a good idea to obtain one before a property is put on the market.

Also, talk with the escrow officer where the escrow will be processed prior to contract acceptance to find out what the officer will do on a FIRPTA transaction and what requirements must be met for a post-closing holdback.

A seller and buyer should always consult with a qualified CPA or tax attorney regarding FIRPTA.

Conclusion
In 2016, the Arizona real estate market will likely see more FIRPTA transactions with foreigners, specifically Canadians, selling their U.S. properties.  A knowledge of FIRPTA by both the foreign seller and buyer will help ensure a smother closing.      

Fletcher R. Wilcox is vice president of business development at Grand Canyon Title Agency

FWilcox@GCTA.com

602.648.1230


Phoenix Real Estate: Attend the first major real estate event of 2016! Why 2016 likely will be a better year for sales, guest speakers on closing trends and a special speaker from the CFPB!

Growth

Jim Sexton 2015 President Arizona Association of REALTORS and Fletcher R. Wilcox Grand Canyon Title invite you to attend the first major event in 2016 on residential closing trends you should know and obtain three C/E hours of contract law. We have put together an event which will bring you up to date on residential closings.  Bring your questions, listen and learn. This is an Industry Partners Conference follow-up event. There will be a special guest speaker from the Consumer Financial Protection Bureau. See bio below!

Find out why it is likely there will be more residential sales in 2016 than 2015. (You have to see this!)

REGISTRATION DETAILS:

www.AARonline.com/event/E/TRIDFEB

Attend the class! TRID LIVE: Real Stories, Real Solutions. Three hours of C/E in contract law. February 4, 2016 | 8:00 a.m. to 1200 p.m. OrangeTree Golf Resort 10601 N. 56th Street, Scottsdale AZ 85254

Panel of designated brokers: Martha Appel, Coldwell Banker; Gerry Russell, Realty Executives, Laurie McDonnell, United Brokers Group

Panel of lenders: Sherry Olsen, Desert Schools Federal Credit Union, Matthew Kelchner, Suburban Mortgage

Panel of escrow officers: Leslie Banes, First American Title; Patti Shaw, Old Republic Title,

Moderators: Jim Sexton, 2015 AAR President and Fletcher R. Wilcox, Grand Canyon Title

Download (PDF, Unknown)

Topics

  • What can lenders provide buyers to strengthen their offers, in addition to the PQF?
  • Is it taking longer to close under TRID? Yes, no, or sometimes?
  • Triggers that might delay a closing.
  • Are loan documents being signed three days before the close of escrow?
  • Closings and FIRPTA. Do you know what the IRS says when there is a foreign seller?
  • Are you seeing the buyer’s Closing Disclosure? The seller’s Closing Disclosure?
  • When can agents review the settlement statement?
  • Why are agents getting different settlement statements in their closing package?
  • Do you have questions on the changes to the AAR Resale Contract, PQF, LSU and TRID?
  • Special presentation on top ten ARMLS violations.

Noerena Limon from the Consumer Financial Protection Bureau (CFPB) will be our guest speaker. She is a policy analyst in the CFPB Office of Research Markets and Regulations and is the project lead for the Know Before You Owe, Closing Time Initiative. Throughout her 2-and-a-half years at the CFPB, Noerena has worked in the Office of Director Richard Cordray, the Office of Mortgage Markets and the Office of Liquidity Lending, focusing on mortgage and small dollar lending policy.


Phoenix Real Estate: What’s new? Webinar December 15 from 12:00 p.m to 1:00 p.m sponsored by the Arizona Association of REALTORS!

What’s new with real estate closings and TRID? Check out this webinar from the Arizona Association of REALTORS!

https://aar.uberflip.com/h/i/181800174-trid-part-3-12-15-15

Fletcher Wilcox, Grand Canyon Title Agency will be joining 2015 AAR President Jim Sexton to talk about the recent changes to residential closings. We will discuss financing, getting your buyers pre-approved, contract timelines, the settlement statement, changes to the AAR Resale Contract, TRID, and we will be taking your questions.  Join us?


fletch

Jim Sexton                                                                                                                                              Fletcher R. Wilcox

2015 President                                                                                                                       V.P. Business Development

Arizona Association of REALTORS                                                                                  Grand Canyon Title Agency

Designated Broker Realty One

Greater Phoenix Real Estate: What happened to all the distressed sales? October sales trends and estimated months of supply by price range.

Sold Sign

Looking back five years

This report reviews existing single family home sale activity in Greater Phoenix.  Greater Phoenix in this report is defined as Maricopa County.

In October 2011 distressed sales drove sales.  In October 2011 66% of existing single family sales were distressed sales.  In October 2015 distressed sales were 6% of existing single family sales.

The 6% or 267 distressed sales in October 2015 were categorized by 132 lender owned sales, 111 short sales and 24 HUD sales.  Contrast this to October 2011 when there were 3,692 distressed sales made up of 1,843 lender owned sales, 1,590 short sales and 111 HUD sales.

Large numbers of distressed sales knocked down prices.  October 2011 had 485 sales under $50,000 compared to 9 in October 2015.  The median sales price of an existing single family home in October 2011 was $125,000.  In October 2015 it was $236,000.

Don’t expect a sudden supply of distressed properties to hit the market any time soon.  A major indicator of future distressed sales is foreclosure starts.  According to NetValueCentral.com in October 2011 there were 3,623 foreclosure starts compared to 770 in October 2015.  The all-time record for the most foreclosure notices filed in a single month in Maricopa County was March of 2009 when there were 9,052.

Download (PDF, Unknown)

Category October 2011 October 2015 Change % Change
Existing Sales 5,625 4,619 -1,006 -18%
Distressed Sales 3,692 267 -3,425 -93%
Lender Owned Sales 1,843 132 -1,711 -93%
Short Sales 1,590 111 -1,479 -93%
HUD Sales 259 24 -235 -91%
Sales Under $50,000 485 9 -476 -98%
Foreclosures Notices 3,623 770 -2,853 -79%
Median Sales Price $125,000 $236,000 $111,000 89%

October 2015 Existing Single Family Home Sales

Sales in October 2015 were slightly higher than in October 2014. Overall, sales for the first ten months of 2015 are 4,698 or 9.8% higher than sales compared to the same period last year.

New Monthly Listings

From January through May of 2015 there were 1,641 less new monthly listings compared to the same time period of last year. Then the June weather must have changed things. Starting in June 2015 through October, 1,853 more sellers put their single family homes on the market than for the same months in 2014.

Download (PDF, Unknown)

October 2015 Estimated Months of Supply by Price Range

Sales under $300,000 were hot. The estimated months of supply for sales under $300,000 ranges from .8 months to 2.6 months. The table below shows the estimated months of supply by price range on November 18.

Short sales, lender owned sales and HUD sales made up six percent of existing single family sales in October. There were only 11 distressed sales over $500,000.

The most expensive home sale in October was a 33,000 square foot home that sold for $7,315,000 in Paradise Valley.

Is the existing single family market a buyer or seller market? Let’s answer this question from a supply and demand perspective.   The general rule is that around six months inventory represents an equilibrium market between demand and supply or between seller and buyer. Below you can find the estimated months of supply by price range.

Download (PDF, Unknown)

Fletcher R. Wilcox

V.P. Business Development

Real Estate Analyst

CFPB External Operations Expert

Grand Canyon Title Agency

A Division of FNTA

602.648.1230

 Author of www.TheWilcoxReport.com

A report on real estate, lending and job growth trends in Greater Phoenix.

Twitter@FletchWilcox

 Grand Canyon Title Agency is a wholly owned subsidiary of the Fortune 314 company FNF.

 Disclaimer

The information in this report may not be the opinion of Grand Canyon Title Agency.

While deemed accurate this report does not guarantee the accuracy of the data.  Some numbers will change.  Report may not reflect all real estate activity.  Information should be verified.  This article is of a general nature, and is not intended as investment advice, real estate advice, lending advice or legal advice.  Please consult your broker, your lender, your own independent legal counsel, your certified public accountant.

Note: Included in some of the charts in this report may be a small number of new home sales.

A Report on Pinal County Existing Single Family Sales, Median Sales Price, How Homes Were Purchased And New Monthly Listings

Download (PDF, Unknown)


Scottsdale Real Estate: Who has the advantage the buyer or the seller?

Sales

Let’s answer this question from a supply and demand perspective.   The rule is that around six months of supply is an equilibrium market, meaning neither the buyer or seller has an advantage when it comes to supply and demand.  Let’s review the table below.

We see in the table that in September 2015 homes priced under $600,000 have an estimated months of supply of 3.5 months or less.  Homes priced between $600,000 and $699,999 have 4.5 months.  Homes between $700,000 and $899,000 are at 6 months.  Homes between $1,500,000 and $1,999,999 have a 25 month supply.

So the lower the price, the more demand.  Thus, more of a seller’s market and the opposite is true for higher priced properties.

Also, as shown in the table out of the 399 sales in September there were three short sales and eight lender owned sales.  The distressed market has almost disappeared.

Download (PDF, Unknown)

The next two tables compare monthly sales and monthly new listings year-over-year for the first nine months. For the first nine months of 2015, there were 311 or 9% more sales than 2014.

When comparing new monthly listings, there were 175 less new monthly listings in the first six months of 2015 than 2014, but this trend reversed from July through September or the third quarter.  In the third quarter new monthly listings were 160 higher in 2015 over 2014. 

Download (PDF, Unknown)

The next chart show how existing single family properties were purchased by two categories, either cash or with a loan.  In 2015, there were 310 more purchases with a loan compared to 2014.

The next chart is for purchases over $1,000,000.  In 2015, there were 20 more purchases over $1,000,000 than in 2014.  Sixteen of these purchases were with a loan.

Download (PDF, Unknown)

So who has the advantage? The buyer or seller?  From a supply and demand perspective in September sellers were favored for sales under $600,000.  For sales between $700,000 and $899,999 it is a flip of the coin, while sales over $900,000 favored buyers.

Overall sales are up in 2015 over 2014.  The increase in demand is with buyers purchasing with a loan or mortgage.  This demand to purchase with a loan most likely will continue to grow since Scottsdale has job growth and people desire to live in Scottsdale.

Let’s keep an eye on new monthly listings and see if the fourth quarter follows the third quarter trend of the year-over-year increase in new monthly listings.

The information in this report is compiled from ARMLS (Arizona Regional Multiple Listing Service, Inc.)

Fletcher R. Wilcox

V.P. Business Development

Real Estate Analyst

CFPB External Operations Expert

Grand Canyon Title Agency

A Division of FNTA

602.648.1230

 Author of www.TheWilcoxReport.com

A report on real estate, lending and job growth trends in Greater Phoenix.

Twitter@FletchWilcox

Scottsdale Real Estate: A Buyer or Seller Market?

SalesWhen selling or buying an existing single family home in Scottsdale who has the advantage buyers or sellers?

Let’s answer this question from a supply and demand perspective.   The rule is that around six months of supply is an equilibrium market, meaning neither the buyer or seller has an advantage when it comes to supply and demand.  Let’s review the table below.

We see in the table that in September 2015 homes priced under $600,000 have an estimated months of supply of 3.5 months or less.  Homes priced between $600,000 and $699,999 have 4.5 months.  Homes between $700,000 and $899,000 are at 6 months.  Homes between $1,500,000 and $1,999,999 have a 25 month supply.

So the lower the price, the more demand.  Thus, more of a seller’s market and the opposite is true for higher priced properties.

Also, as shown in the table out of the 399 sales in September there were three short sales and eight lender owned sales.  The distressed market is also gone.

Download (PDF, Unknown)

The next two tables compare monthly sales and monthly new listings year-over-year for the first nine months.  in 2015 there are 311 or 9% more sales than 2014.

When comparing new monthly listings, there were 175 less new monthly listings in the first six months of 2015 than 2014, but this trend reversed from July through September or the third quarter.  In the third quarter new monthly listings were 160 higher in 2015 over 2014. 

Download (PDF, Unknown)

The next chart show how existing single family properties were purchased by two categories, either cash or with a loan.  In 2015, there were 310 more purchases with a loan compared to 2014.

The next chart is for purchases over $1,000,000.  In 2015, there were 20 more purchases over $1,000,000 than in 2014.  Sixteen of these purchases were with a loan.

Download (PDF, Unknown)

So what is the conclusion on whether it is a seller or buyer market?  From a supply and demand perspective only, in September sellers were favored for sales under $600,000.  Sales between $700,000 and $899,999 it is a flip of the coin, while sales over $900,000 favored buyers.

Overall sales are up in 2015 over 2014.  There is a notable increase in demand with buyers purchasing with a loan or mortgage.  This demand to purchase with a loan most likely will continue to grow since Scottsdale has both job and population growth.

We need to keep our eye on the third quarter year-over-year increase in new monthly listings.