If the cost of a home is important to a buyer or if appreciation is important to a buyer now may be the best time to write an offer!
Why? In each of the last five years the month that had the lowest median purchase price of the year was the month of January. This is a topic I have written about before, but I want to remind everyone that January can be a good month for buyers to close on a home.
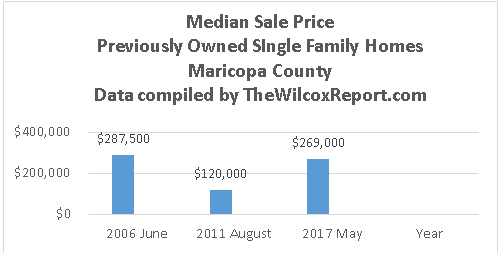
This can be seen in Chart One. Chart One shows the median purchase price for a previously owned single family home in Maricopa County for each month from January 2014 through November 2018. The majority of homes that close in January went under contract in December.
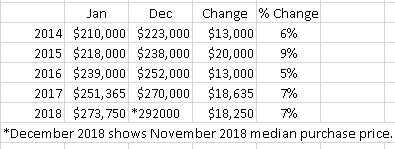
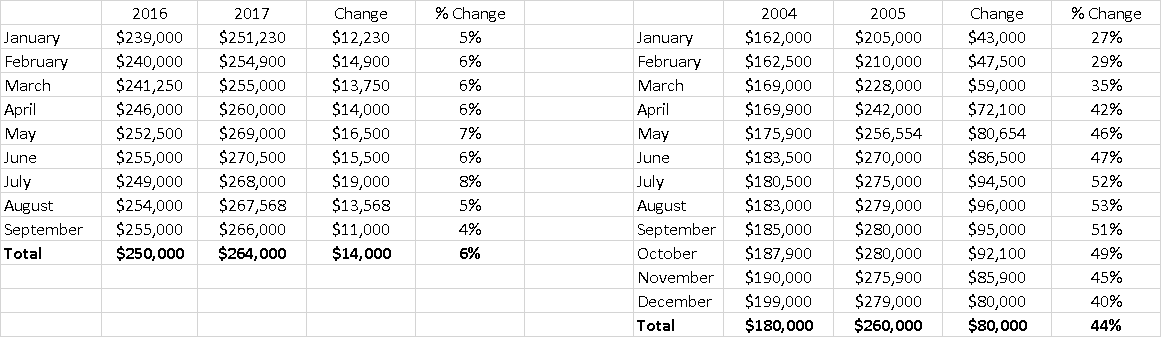
Table One shows the appreciation at the beginning of the year compared to the end of the year. It compares the January median purchase price to the December median purchase price for the last four years, except for 2018 which shows the median purchase price for November. At the end of the last five years the median purchase price was from five percent to nine percent higher compared to the beginning of the year. For example, the median purchase price in January 2018 was $273,750. In November it was $292,000 seven percent or $18,250 higher than in January.
What if a buyer missed closing in January but will close in February? Chart One shows that February is the month with the second lowest median purchase price of the year!
So if price and appreciation are important to a buyer now may be the best time to write an offer with a January or February closing.
A point to remember is that for both Chart One and Table One the information is for previously owned single family homes in Maricopa County. Any city, or zip code, or subdivision within Maricopa County may trend differently.
May you have a Merry Christmas and a Happy New Year!
Fletcher R. Wilcox
V.P. Business Development, Real Estate Analyst & Author of www.TheWilcoxReport.com
A report on real estate, lending, population and job growth trends in Greater Phoenix.
Grand Canyon Title Agency
602.648.1230

Grand Canyon Title Agency is a wholly owned subsidiary of the Fortune 302 company FNF
Chart One
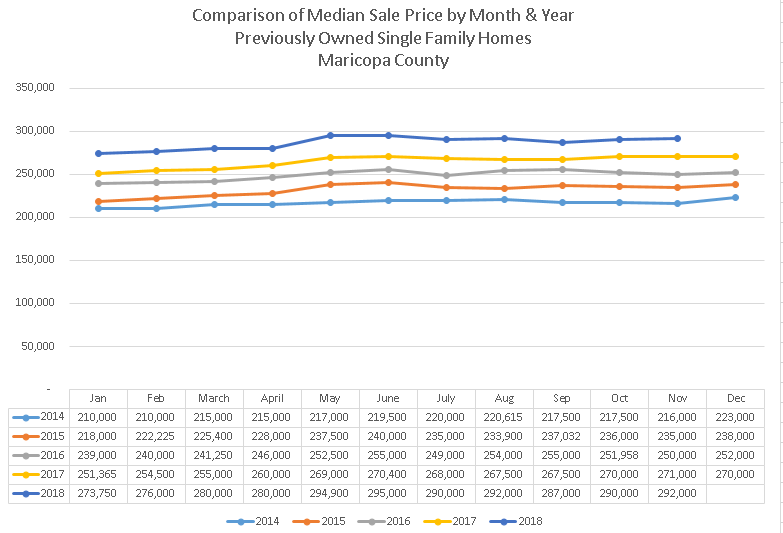
Table One
![]()


Follow Fletcher