Home Prices Keep Going Up in Greater Phoenix!

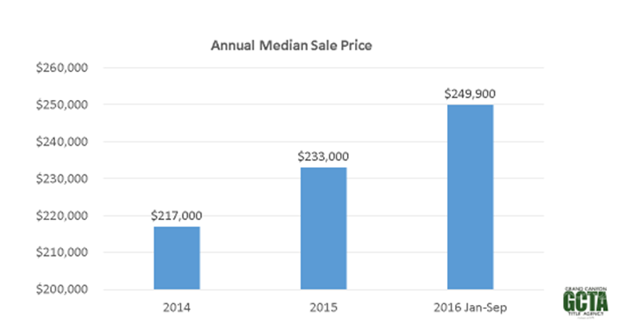
It has been a long time since the median sale price for a previously owned single family home was this high.

May 2017 Results  

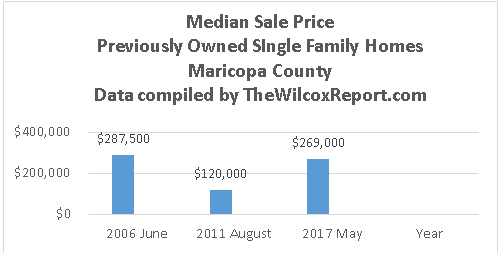
The median sale price for a previously owned single family home in May was $269,000. The last time the sale price was at the $269,000 level was almost ten years ago.  It was August of 2007.

The data in this report was compiled from the Arizona Regional Multiple Listing Services, Inc.  The geographic area is Greater Phoenix (Maricopa County).

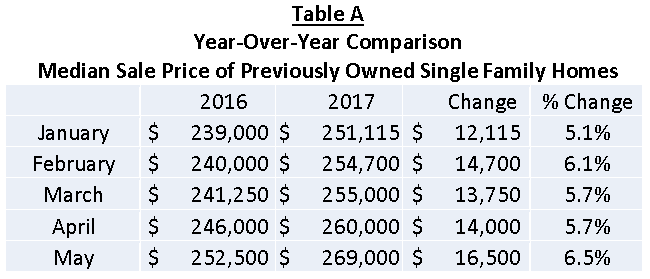
The May 2017 median sale price represented a year-over-year increase of 6.5% or $16,500 compared to May 2016 when it was $252,500. This is a healthy increase.  See Table A.

A Brief History of Median Sale Price

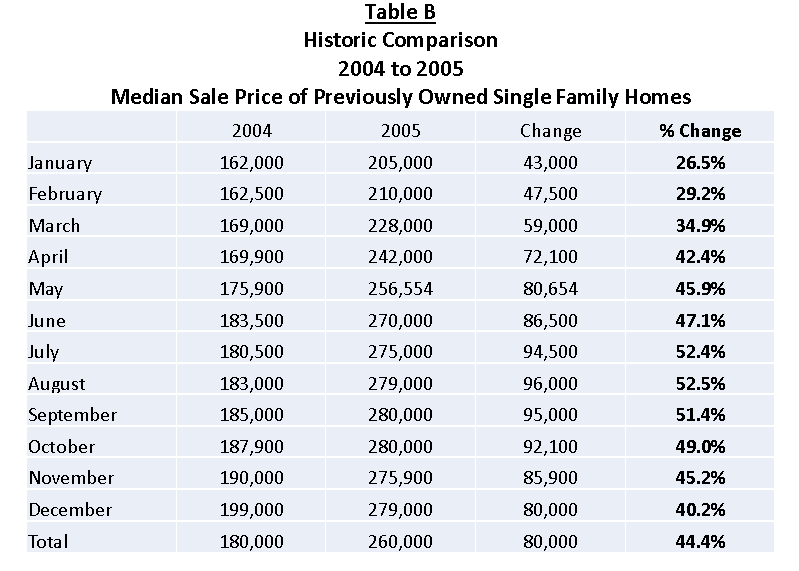
The first time in Maricopa County history that the median sale price of a previously owned single family home reached the May 2017 level was in June 2005. Back then the year-over-year increase was not 6.5% or even close.  It was 47.1% or $86,500.  It went from $183,500 in June 2004 to $270,000 in June 2005.  See Table B.

The May median sale price of $269,000 has come a long way since August 2011 when it bottomed at $120,000. But it still has a little way to go to reach the peak month of $287,500 in June 2006.
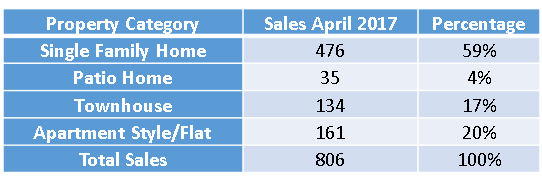
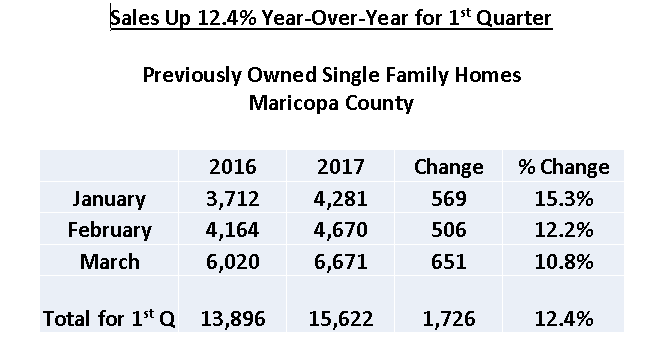
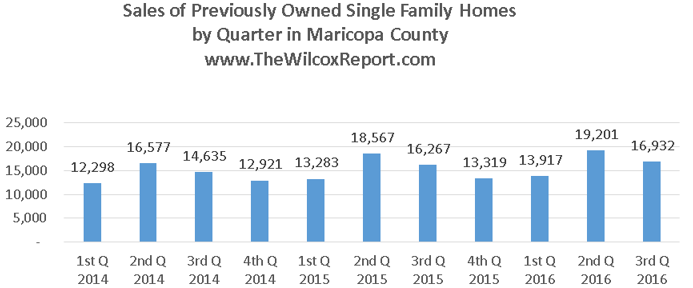
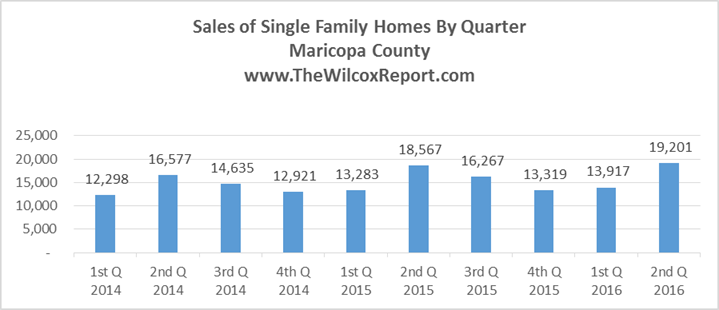
Sales in May 2017

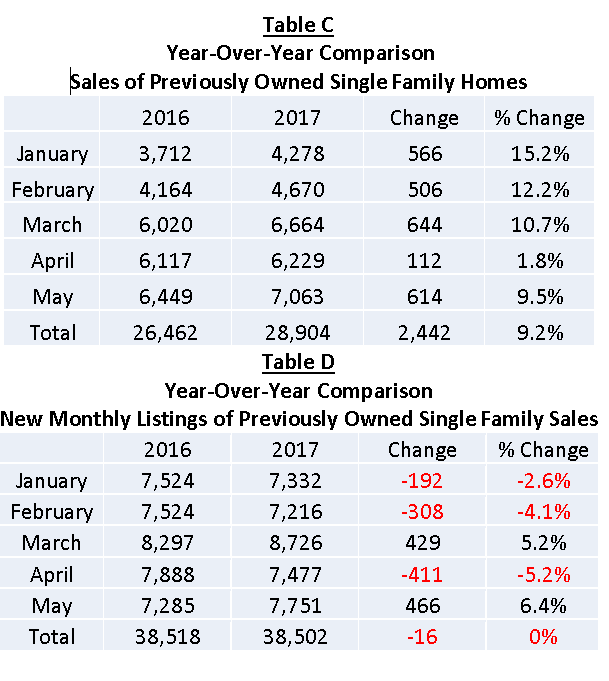
May 2017 sales were up 9.5% or by 614 compared to May 2016. Additionally, May 2017 sales were up 13.3% or by 834 over April 2017.  Compare this to May 2016 sales which were up 5.4% or by 332 over April 2016.  See Table C.

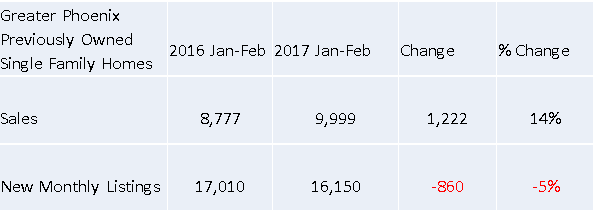
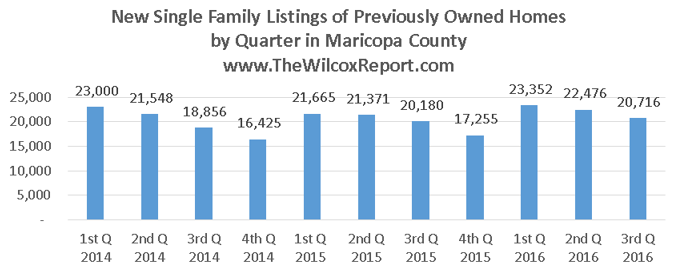
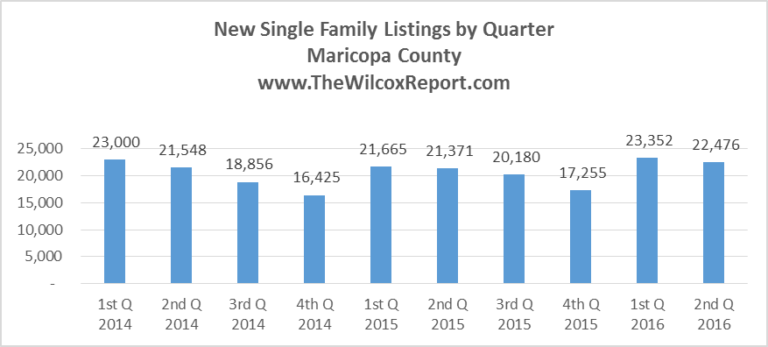
New Monthly Listings in May 2017

May 2017 new monthly listings had the highest year-over-year increase for a month this year. There were 466 more listings that hit the market this May than last May.  This jump in inventory most likely will help keep up sales momentum in June and July.

Overall, the number of new monthly listings is flat when comparing the number for the first five months of 2017 to 2016. See total in Table D.

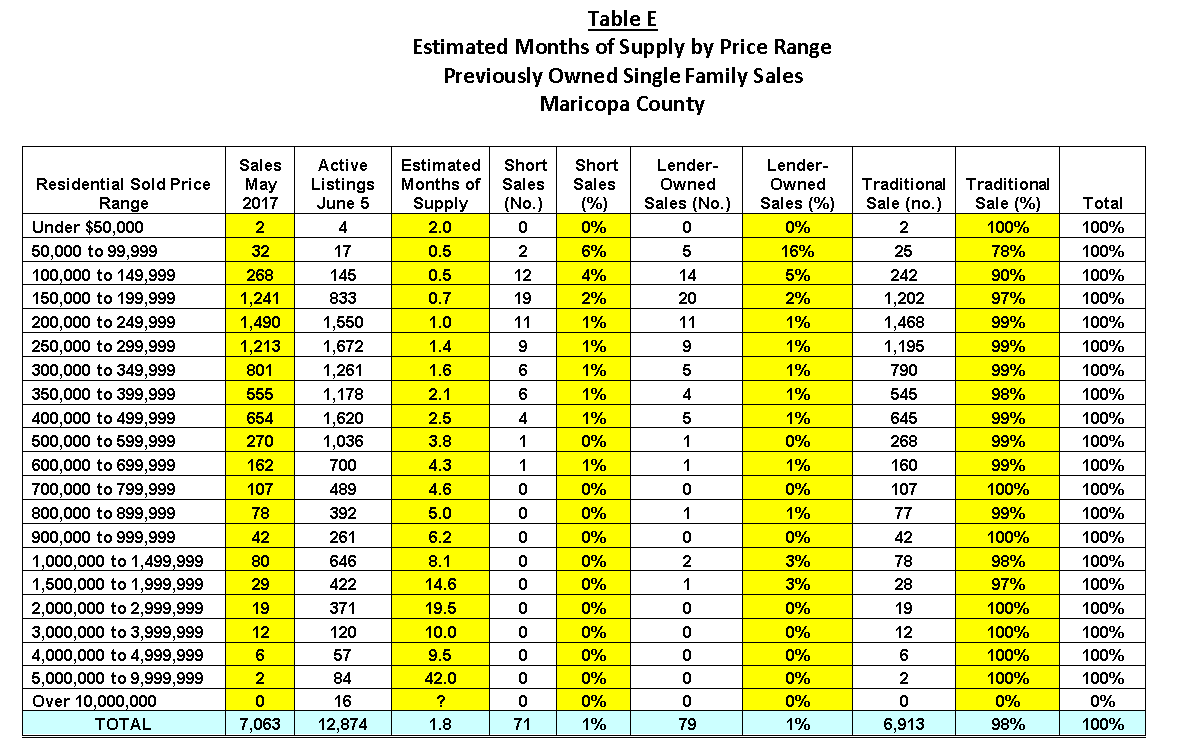
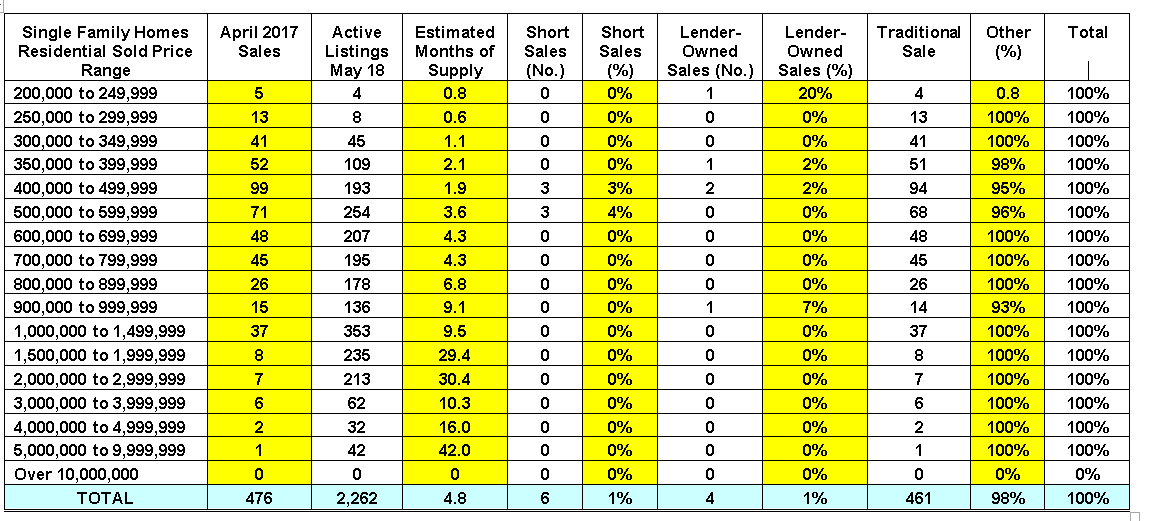
Estimated Months of Supply by Price Point

It is a seller’s market for homes priced under $600,000 (as long as they are priced right). For all price points under $600,000 the estimated months of supply is under four months.  The price range with the highest number of sales was $200,000 to $249,999.  The estimated months of supply in this range was one month.  See Table E.


Fletcher R. Wilcox is V.P. of Business Development and a Real Estate Analyst at Grand Canyon Title Agency.
He is author of www.TheWilcoxReport.com. His market analysis on residential real estate in Greater Phoenix has been referenced in the Phoenix Business Journal, the Wall Street Journal, Bloomberg News, MarketWatch, HousingWire.com, National Mortgage News, and the Arizona Republic. He has been a guest speaker on local radio and both local and national TV.
He teaches real estate agents marketing strategies and teaches residential contract writing and Arizona title procedures. He served on one of the subcommittees at the Arizona Association of REALTORS subcommittees making recommendations on changes to the February 2017 AAR Residential Resale Real Estate Purchase Contract. Fletcher started snowboarding in 2006. He is not very good.   Fletcher may be reached at FWilcox@GCTA.com  602.648.1230

Real Estate Agents: Contract law class in beautiful new construction luxury home in Heart of Scottsdale!

 June 22, 9:30 a.m. to 1:00 p.m.

Contract to Closing: Contingencies, Clauses and Cures for three hours of contract law.

Enjoy the class in a brand new luxury home in the Heart of Scottsdale. The home is approximately 4,341 square feet priced at $1,820,000.  Tour the home at 9:30 a.m. and meet the builder.  Class is from 10:00 a.m. to 1:00 p.m.

Fox Haven by Cachet Homes

Class location: 10332 N. 79th Way, Scottsdale, 85258 (Hayden and Gold Dust, just south of Shea Blvd.)

MUST RSVP FWilcox@GCTA.com or 602.648.1230   Cost is ($10.00) dollars.


Class by Internal Dynamics School of Real Estate 13565 N. 102nd Place, Scottsdale 85260  602.363.2960  mbarnewolt@msn.com


We will use real life scenarios involving the AAR Residential Resale Real Estate Purchase Contract. 

Scenarios 

Inspection period

BINSR

Seller concessions

Release of earnest money

Risk of loss clause

Contingency clauses versus promise clauses

When do I deliver a cure period notice

Breach of contract

Commitment for title

What is FIRPTA?

There will be a review of the contract timelines 

p.s. I served on one of the subcommittees at the Arizona Association of REALTORS which made the changes to the new contract released February 2017.

Fletcher R. Wilcox  

Contact me to open your next escrow with our Scottsdale office located at 8520 E. Shea Blvd., Suite 115, 85260.

Fletcher R. Wilcox is the author of The Wilcox Report and Vice President of Business Development for Grand Canyon Title. His market analysis has been referenced in the Wall Street Journal, Bloomberg News, HousingWire.com and National Mortgage News. He served on one of Arizona Association of Realtor’s 2017 Residential Resale Contract subcommittees. He may be reached at FWilcox@GCTA.com  or by phone at 602-648-1230.

Recent media appearances

May 17, 2017 in the Phoenix Business Journal  http://www.bizjournals.com/phoenix/news/2017/05/11/existing-home-sales-highest-since-2006-up-18-over.html

May 12, 2017 KTAR    https://ktar.com/story/1570668/maricopa-county-home-sales-up-18-percent-near-prerecession-numbers/

Television interviews

My interview with Gerri Willis on the Fox Business News Network

Interview with Jim Belfiore on Square Off Arizona. Topic: The President and Housing.

Interview on Horizon on housing market.


Scottsdale Report: Residential Real Estate Trends for April 2017. Estimated months of supply for single family homes and more!

This report is on Scottsdale sales and new listing trends for single family, apartment style, townhouse and patio homes.

The data was compiled from the Arizona Regional Multiple Listing Services, Inc. (ARMLS).

In April, of the four residential categories, single family homes had the most sales at 476 or 59% of all sales.  Second was Apartment Style / Flat homes with 161 sales.

Single Family Homes Estimated Months of Supply by Price Range

As can be seen in the table, homes in the lower price ranges generally have lower estimated months of supply.  Generally when there is a four month of supply or less it is considered a seller’s market.  Out of the 476 sales only ten were either a short sale or lender-owned sale.

April 2017

As can be seen, sales in three of the four categories were up this April over last April.  Townhouse sales had the greatest increase at 34%, while single family sales were down 4%.  Even though single family homes were down this April compared to last April, single family home sales are up ten percent for the first four months of 2017 (see the table below in the section Sales and New Listing Trends for the First Four Months of 2017).  

How did new monthly listings for the four categories compare in April 2017 to April 2016?

There were less new monthly listings in each of the four residential categories this April compared to last April.

Sales and New Listing Trends for the First Four Months of 2017

Below enter your email address to subscribe to this blog and receive notifications of new updates to The Wilcox Report by email.

Contact me to open your next escrow with our Scottsdale office located at 8520 E. Shea Blvd., Suite 115, 85260.

Fletcher R. Wilcox is the author of The Wilcox Report and Vice President of Business Development for Grand Canyon Title. His market analysis has been referenced in the Wall Street Journal, Bloomberg News, HousingWire.com and National Mortgage News. He served on one of Arizona Association of Realtor’s 2017 Residential Resale Contract subcommittees. He may be reached at FWilcox@GCTA.com  or by phone at 602-648-1230.

Recent media appearances

May 17, 2017 in the Phoenix Business Journal  http://www.bizjournals.com/phoenix/news/2017/05/11/existing-home-sales-highest-since-2006-up-18-over.html

May 12, 2017 KTAR    https://ktar.com/story/1570668/maricopa-county-home-sales-up-18-percent-near-prerecession-numbers/

Television interviews

My interview with Gerri Willis on the Fox Business News Network

Interview with Jim Belfiore on Square Off Arizona. Topic: The President and Housing.

Interview on Horizon on housing market.

First Quarter 2017: Residential Sales Volume Highest in Eleven Years!

First Quarter 2017 Results

Previously Owned Single Family Homes

Maricopa County  

Data compiled from the Arizona Regional Multiple Listing Services, Inc.

Sales volume in the first quarter of 2017 was the highest since 2006, which was before the great real estate recession. First quarter 2017 sales volume was 18.1% higher than the first quarter of 2016.

Sales volume for this report is the total of the sale prices for previously owned single family homes.  An example of  sales volume would if a real estate agents sold 20 homes and the sales price for each home was $250,000 their sales volume would be $5,000,000.

Sales volume is a health indicator of a real estate market.  It not only speaks on the number of sales, but also on their sale price.  It may show if prices are decreasing, flat, or increasing.  For example, in the first quarter of 2017 there were 15,622 sales for a sales volume of $5,016,013,713.  The average or mean sale price was $321,086.  Compare this to first quarter of 2012 when there were more sales, 16,405, but sales volume was lower, $3,144,327,127.  The average sale price then was $191,668.

The 2017 first quarter average sale price of $321,086 was $15,471 or 5% higher than the first quarter of 2016 average of $305,615.

A Formula for Price Increases

While sales were up 12.4% in the first quarter of 2017 year-over-year, new inventory was flat.  There were 1,726 more sales and 81 less new listings.

If the trend of more sales and less inventory continues prices will go up in the price ranges with heavy demand.

Coming soon will be the estimated months of supply by price range.

Below enter your email address to subscribe to this blog and receive notifications of new updates to The Wilcox Report by email.

Open your next escrow with our Scottsdale office located at 8520 E. Shea Blvd., Suite 115, 85260.

Fletcher R. Wilcox is the author of The Wilcox Report and Vice President of Business Development for Grand Canyon Title. His market analysis has been referenced in the Wall Street Journal, Bloomberg News, HousingWire.com and National Mortgage News. He served on one of Arizona Association of Realtor’s 2017 Residential Resale Contract subcommittees. He may be reached at FWilcox@GCTA.com  or by phone at 602-648-1230.

Television interviews

My interview with Gerri Willis on the Fox Business News Network

Interview with Jim Belfiore on Square Off Arizona. Topic: The President and Housing.

Interview on Horizon on housing market.


Which buyer costs can a seller concession now pay?

Sixty Days Later: The New AAR Purchase Contract

Published May 2, 2017 in the Arizona Journal of Real Estate & Business

http://www.asreb.com/2017/05/sixty-days-later-the-new-aar-purchase-contract/

 By

Fletcher R. Wilcox
The Wilcox Report

Grand Canyon Title Agency

As I write this article, it is sixty days since the introduction of the new AAR Residential Resale Real Estate Purchase Contract on February 1, 2017. I will review the change in seller concessions, which is a hot topic, and touch on something that recently happened when a seller agreed to pay the initial appraisal fee — and it was to be included in the seller concessions.

The Seller Concessions clause in the new AAR Contract reads:

2J. Seller Concessions (if any): In addition to the other costs Seller has agreed to pay herein, Seller agrees to pay up to ____% of the Purchase Price OR up to $____ to be used only for Buyer’s loan costs, impounds, Title/Escrow Company costs, recording fees, and, if applicable, VA loan costs not permitted to be paid by Buyer.

Much of the discussion on seller concessions centers on the word prepaids which was removed and the addition of the language to be used only for.

Why was prepaids removed from the clause?

In the previous contract the word prepaids was loosely applied. Often when not all of the seller concessions were used after paying for loan costs, impounds, and title/escrow costs any remaining concessions would be used to perhaps prepay additional months of HOA, or maybe prepay pool service, etc. I have heard of seller concessions being applied to pay a buyer’s credit cards and buyer broker commission. While not all sellers may object to these applications, some vehemently did.

Most seller challenges as to what their concessions were to pay happen after receipt of the settlement statement, which is usually just days before a transaction is to close. When a seller and buyer cannot agree on the concessions, an addendum is often needed clarifying what may be paid before the transaction can close.

Since the new contract added the words to be used only for, questions that keep arising is if the lender is required one year of homeowner’s insurance and is the mortgage interest from the close of escrow to the first mortgage payment considered a loan cost? On March 28, 2017 AAR stated, “Both interest and the homeowner’s insurance premiums are costs that the lender requires to be paid as a condition to funding a loan. Thus, those items are considered to be loan costs as that term is used in Section 2j. Accordingly, the interest and homeowner’s insurance premiums would be included in the Seller Concessions as agreed by the parties.”

If there are remaining seller concessions may they be used to prepay items such as additional months of HOA or an additional year of home warranty? Probably not, since neither of these items is a loan cost or a condition to fund the loan.

Additional Seller Concessions are Negotiable
Just as all repairs are negotiable since the seller warranties were removed from the new Contract, the buyer may negotiate additional items that seller concessions may pay. A buyer may want to add language in the Additional Terms and Conditions section of the Contract to read something like this, “Seller concessions to be applied to the following items…”

Initial Appraisal Fee and Seller Concessions
Section 2m lines 111-113 read:

Initial appraisal fee shall be paid by __Buyer __Seller __Other  at the time payment is required by lender and is non-refundable. If Seller is paying the initial appraisal fee, the fee __will __will not be applied against Seller’s Concessions at COE, if applicable.

Recently, a seller agreed to pay the initial appraisal fee of $500 to the lender at the beginning of the transaction. The $500 was to be applied against a seller concession of $4,000.

When the Closing Disclosure was sent to the seller it showed the seller’s concession at COE to be $4,000 instead of reducing it to $3,500, since the seller had already paid $500 for the appraisal.

Apparently, the lenders software was not able to show the seller paying the initial appraisal fee outside of escrow. The Closing Disclosure incorrectly showed that the buyer had paid it outside of escrow. Since the problem was found before closing it was resolved.

Conclusion
Most buyers think that when a seller agreed to give them a concession they will be able to use all of it. They do not understand all the nuances of its application. A buyer may consider adding language to the Contract, and they should discuss with their lender any limitations the lender may have with a seller concession.


Fletcher R. Wilcox is the author of The Wilcox Report and Vice President of Business Development for Grand Canyon Title. His market analysis has been referenced in the Wall Street Journal, Bloomberg News, HousingWire.com and National Mortgage News. He served on one of Arizona Association of Realtor’s 2017 Residential Resale Contract subcommittees. He may be reached at FWilcox@GCTA.com  or by phone at 602-648-1230.

Who will be the top real agent, broker and more!

Old Town Scottsdale 2017 Friday Night Industry Party

Awards will be for

  • Residential real estate agent of the year
  • Residential real estate broker of the year
  • Residential rookie agent of the year
  • Residential team of the year
  • Commercial managing principal of the year
  • Commercial real estate broker of the year
  • Home inspector of the year
  • Certified appraiser of the year
  • Escrow officer of the year
  • Title sales representative of the year
  • Mortgage loan originator of the year

Arizona jobs projected to increase by 138,553 and Greater Phoenix jobs by 115,258. More jobs will keep the fire going for already hot housing market.

On March 9, the Arizona Office of Economic Opportunity released job projections.  Jobs in Arizona are projected to increase by 138,553 from the Second Quarter of 2016 through the Second Quarter of 2018.  The majority of the increase in jobs is expected to be in Greater Phoenix.  Jobs in Greater Phoenix are projected to increase by 115,258.  Greater Phoenix in this report is defined as Maricopa and Pinal counties.

This increase in jobs, along with a growing population, will continue to fuel the demand for residential housing.    Greater Phoenix is currently in the midst of a very hot demand for previously owned single family properties in many price ranges.

According to the Arizona Regional Multiple Listing Services, Inc., sales of previously owned single family homes in the first two months of 2017 are fourteen percent higher than for the same period last year.  The number of sales in January and February 2017 were 9,999 compared to 8,777 for the same period last year.

While sales are up inventory is down.  The number of previously owned new monthly listings in January and February 2017 were 5% or 860 less than for the same period last year.

When writing a contract, be prepared for your buyers to compete against multiple offers when a property is priced at market.

Expect prices to go up in many prices ranges.

The majority of the increase in jobs will be in Greater Phoenix 

To read the report go to https://laborstats.az.gov/sites/default/files/documents/files/ST_IndProjReport.pdf

2016-2018 Projected Job Growth by Region
Area Name 2016 Estimated Total Employment Level 2018 Projected Total Employment Level Numeric Growth Annualized Percentage Growth
Arizona 2,852,181 2,990,734 138,553 2.4%
Phoenix MSA1 2,051,434 2,166,692 115,258 2.8%
Tucson MSA2 382,515 392,583 10,068 1.3%
Balance Of State3 414,363 427,176 12,813 1.5%
1) Maricopa and Pinal Counties
2) Pima County 
3) All other areas in Arizona less Maricopa, Pinal, and Pima Counties 

Arizona’s industry employment projections are produced in conjunction with the U.S. Department of Labor (U.S. DOL), Employment and Training Administration (ETA).

Fletcher R. Wilcox is V.P. of Business Development and a Real Estate Analyst at Grand Canyon Title Agency.

He is author of www.TheWilcoxReport.com. His market analysis on residential real estate in Greater Phoenix has been mentioned in the Wall Street Journal, Bloomberg News, MarketWatch, HousingWire.com, National Mortgage News, Arizona Republic and the Phoenix Business Journal. He has been a guest speaker on local radio and both local and national TV.

He teaches real estate agents strategies on marketing and instructs real estate classes in residential contract writing and Arizona title procedures.  Fletcher started snowboarding in 2006. He is not very good.

Fletcher may be reached at mailto:FWilcox@GCTA.com  602.648.1230

When Is The Peak Season For New Listings And Sales? Fourth Quarter 2016 New Listings And Sales Should Be Higher than Last Year!

This is an update of an article published on July 20, 2016. This version includes third quarter 2016 new monthly listings and sales.  The information in this report is from the Arizona Regional Multiple Listing Services, Inc.

Real estate agents make their commissions as listing agents and as selling agents. So at what times of the year are agents the busiest listing seller’s properties and closing on sales with buyers?  What times of the year are listings and sales the slowest?

I researched the number of new listings and sales for previously owned single family homes in Maricopa County, Arizona (sometimes defined as the Greater Phoenix Market). I broke down the years 2014, 2015 and 2016 into quarters.  The data is from the Arizona Multiple Listing Services, Inc. (ARMLS).

The Findings

image001New Listings: Which Quarter Had the Most and the Least?

The first quarter, the winter quarter, had the most new listings. Then like a stair step, the number of new listings declines in each of the following quarters.  In both 2014 and 2015 the fourth quarter had considerable less new listings than the first quarter.  Then as the chart below shows, new listings shoot up again in the first quarter of the New Year.

What is significant in 2016? More Sellers Listing Their Homes.

So far in 2016, more homes have been listed than in either 2015 or 2014. For the first three quarters of 2016 there were 66,544 new listings compared to 63,216 in 2015 and 63,404 in 2014.  So new monthly listings in 2016 are approximately five percent higher than in either 2015 or 2014.

oct-2016-new-listings-by-q

Sales: Which Quarter Had the Most and Least?

Sold Sign


While the first quarter has the most new listings, the second quarter has the most sales – at least in 2014 and 2015. The chart below shows single family sales.  In 2014, the quarter with the least number of sales was the first quarter.  In 2015, it was a toss-up for the least number of sales between the first quarter and the fourth quarter.  There were only thirty-six more closings in the fourth quarter over the first quarter in 2015.  The second best quarter for sales has been the third quarter.

What is significant in 2016? More Sales! Higher Prices!

Sales in the first three quarters of 2016 broke the 50,000 mark. There were 50,050 sales compared to 48,117 in 2015 and 43,510 in 2014.  So sales were 4.0% higher than in 2015 and 15.1% than 2014.  What may be more significant is the sales price.  The median sales price in 2016 for the first three quarters is $249,900 compared to $233,000 in 2015 and $217,000 in 2014.

oct-2016-sales-by-q

oct-2016-median-sales-price

Don’t Stop Working in the Fourth Quarter!

While new listings and sales generally slow-down in the fourth quarter, there will still be plenty of activity. New listings and sales should exceed last year’s fourth quarter results and will end around 18,000 listings with sales close to 14,000!

Fletcher Wilcox 2016 picture

Fletcher R. Wilcox is V.P. of Business Development and a Real Estate Analyst at Grand Canyon Title Agency.

He is author of www.TheWilcoxReport.com. His market analysis on residential real estate in Greater Phoenix has been mentioned in the Wall Street Journal, Bloomberg News, MarketWatch, HousingWire.com, National Mortgage News, Arizona Republic and the Phoenix Business Journal. He has been a guest speaker on local radio and both local and national TV.

He teaches real estate agents strategies on marketing and instructs real estate classes in residential contract writing and Arizona title procedures.  Fletcher started snowboarding in 2006. He is not very good.

Fletcher may be reached at FWilcox@GCTA.com  602.648.1230

New-GCTA-Logo

What time of the year are there the most new listings and the most real estate sales? A review of the numbers in Greater Phoenix.

 When are Real Estate Agents the Busiest?

By

Fletcher R. Wilcox

Grand Canyon Title Agency

Real estate agents make their commissions as listing agents and as selling agents. So at what times of the year are agents the busiest listing seller’s homes and closing on sales with buyers? What times of the year are listings and sales the slowest? Does real estate activity really slow down in the hot summer months?

So, what I did was research the number of new listings and sales for existing single family homes in Maricopa County, Arizona.  I broke down the years 2014, 2015 and the first half of 2016 into quarters. The data is from the Arizona Multiple Listing Services, Inc. (ARMLS).

The Findings

image001

New Listings: Which Quarter Had the Most and the Least?

In both 2014, 2015 and in the first half of 2016 we saw the same pattern for new listings. The first quarter, the winter quarter, had the most new listings. Then like a stair step, the number of new listings declines in each of the following quarters with the fourth quarter having considerable less new listings than the first quarter. Then as the chart below shows, listings shoot up again in the first quarter of the New Year.

More New Listings and Sales in First-Half of 2016 Than in Either 2014 or 2015

When comparing the number of new listings in the first two quarters of 2016 there were 2,792 more new listings than 2015 and 1,280 than 2014. This increase in inventory along with job growth and population growth and boomerang buyers has fueled home ownership. There were 1,268 more sales in the first two quarters of 2016 than 2015 and a whopping 4,243 more sales than 2014.

image001


Sales

Sales: Which Quarter Had the Most and Least?

While the first quarter has the most new listings, the second quarter has the most sales. The chart below shows single family sales. In 2014, the quarter with the least number of sales was the first quarter. In 2015, it was a toss-up for the least number of sales between the first quarter and the fourth quarter. There were only thirty-six more closings in the fourth quarter over the first quarter. The second best quarter for sales has been the third quarter.

There are More Sales in the Hot Summer Months Than You Might Think

If we compare sales in the third quarter, the hot weather months of July, August and September, to the best quarter, the second quarter, we saw a decline in sales of 12% in both 2015 and 2014.

However, the third quarter has been the second best quarter for sales. In 2015, third quarter sales were 18% higher than in both the first and fourth quarters.

image002

Conclusions

In recent history, the first and second quarters of the year had the most new listings followed by the second and third quarters as the most sales. While real estate sales slow-down in the hot weather third quarter compared to the spring second quarter, the third quarter has been the number two quarter for most sales. While sales in the first and fourth quarters are the slowest, there is still lots of sales activity. Data shows sales in the first and fourth quarters range between 12,000 and 14,000. Look for sales in the fourth quarter of  2016 to be over 14,000 sales.

Fletcher Wilcox 2016 picture

Fletcher R. Wilcox is V.P. of Business Development and a Real Estate Analyst at Grand Canyon Title Agency.

He is author of www.TheWilcoxReport.com. His market analysis on residential real estate in Greater Phoenix has been mentioned in the Wall Street Journal, Bloomberg News, MarketWatch, HousingWire.com, National Mortgage News, Arizona Republic and the Phoenix Business Journal. He has been a guest speaker on local radio and both local and national TV.

He teaches real estate agents strategies in marketing and instructs real estate renewal classes in residential contract writing and Arizona title procedures.  Fletcher started snowboarding in 2006. He is not very good.

Fletcher may be reached at FWilcox@GCTA.com  602.648.1230


Report: More luxury sales in 2016 than 2015. Join me on the Biltmore Estates luxury tour this Wednesday, April 20.

The upper end of the market has had more sales so far this year than last year.

According to data from the Arizona Regional Multiple Listing Services, Inc. (ARMLS) there were twenty-one more sales over $1,000,000 of previously owned single family homes in the first quarter of 2016 than the first quarter of 2015.  The geographic area is Maricopa County.

The table below segments the sales by price range.

Download (PDF, Unknown)

Join me this Wednesday, April 20 from 11:00 a.m. to 1:00 p.m. for a tour of six homes in the Biltmore Estates.  The beautiful Biltmore Estates is located on Lincoln west of 32nd street in Phoenix.  See the great views!   NOTE: THIS IS A REAL ESTATE AGENT ONLY TOUR.

Download (DOCX, 842KB)

Hope to see you!

Fletcher R. Wilcox

V.P. Business Development

Real Estate Analyst

Grand Canyon Title Agency

A Division of FNTA

602.648.1230

Author of www.TheWilcoxReport.com

A report on real estate, lending and job growth trends in Greater Phoenix.

Twitter@FletchWilcox

New-GCTA-Logo