Contract Law Class in New $2,148,650 Staged Home in the heart of Scottsdale by Cachet Homes!

Wednesday, June 27 10:00 a.m. to 1:00 p.m.


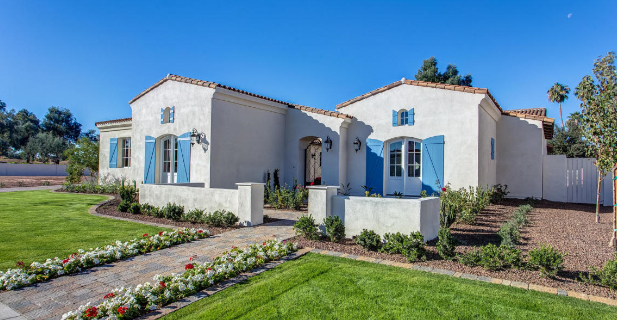
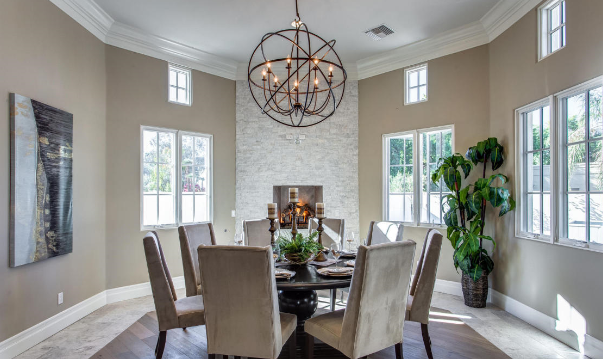
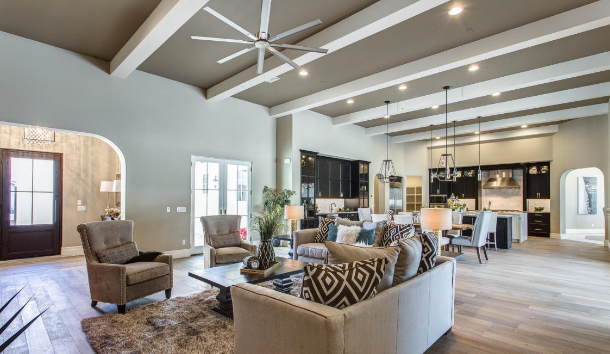
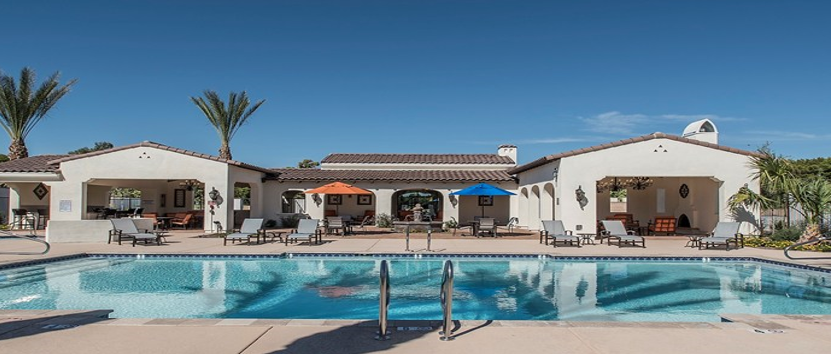
Custom features include: Sierra Pacific wood windows and doors, Sub-Zero, Wolf and Asko appliances, a completed resort style rear yard including a pool, spa, outdoor fireplace and BBQ. 4,478 sq. ft. includes 4 bedrooms, 4 1/2 baths, game room, den.


When: June 27 from 10:00 a.m. to 1:00 p.m.

This is a complementary class and lunch by Cachet Homes. Come early and tour Cachet Homes newest custom home at Fox Haven.


Where: 10333 N 79th Way, Scottsdale, 85258

While on Hayden go West on Gold Dust which is one block south of Shea Blvd.

and then turn right on 79thWay.


RSVP to FWilcox@GCTA.com or mailto:sgoodrich@cachethomes.net

CONTRACT TO CLOSING: CONTINGENCIES, CLAUSES & CURES

Three hours of contract law continuing education

INTERNAL DYNAMICS SCHOOL OF REAL ESTATE

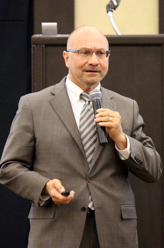
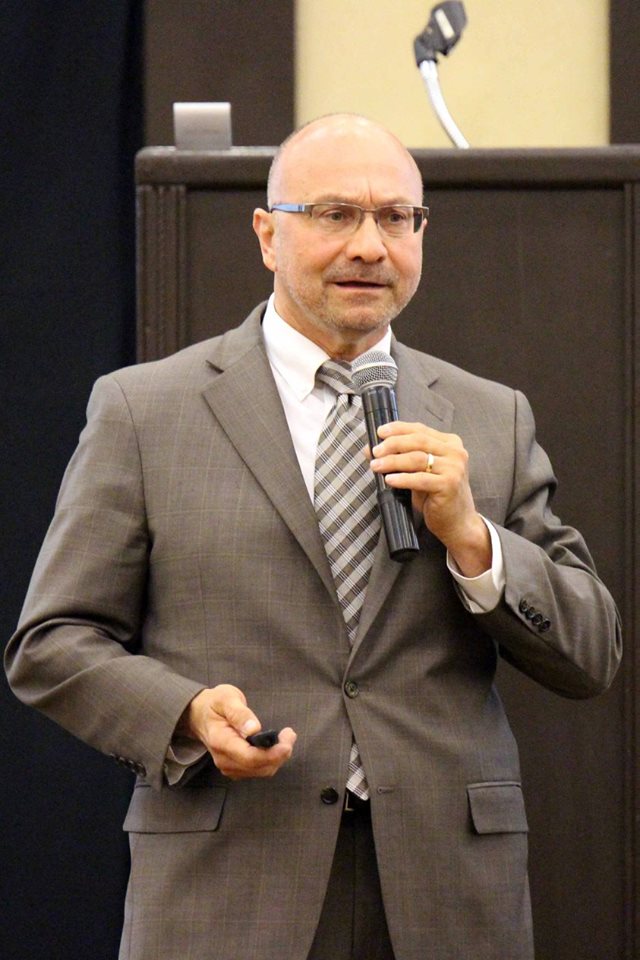
Class taught by Fletcher R. Wilcox, V.P. Grand Canyon Title. Fletcher served on one of the Arizona Association of REALTORS subcommittees which made recommendations to the February 2017 AAR Residential Resale Real Estate Contract.

2018 New Tax Law: How it affects Sellers, Buyers and REALTORS!


Learn about the New Tax Law!


When:  January 25 from 10:00 a.m. to 12:00 p.m.


Where: 10300 N. 79th Way, Scottsdale, 85258 Class will be in a brand new $2,000,000 staged luxury home by Cachet Homes.

One block south of Shea Blvd., turn on Gold Dust just west of Hayden Road.

DO NOT GOOGLE ADDRESS — IT WILL TAKE YOU TO THE WRONG LOCATION!

RSVP to Fwilcox@GCTA.com  602.648.1230


2018 Projections for the Single-Family Homes Market

 Published November 1, 2017 | Arizona Journal of Real Estate & Business

Fletcher Wilcox
Founder, The Wilcox Report                                                         

Previously-owned single-family homes comprise the majority of residential sales — approximately 80 percent of all residential real estate sales in the Arizona Regional Multiple Listings Services, Inc. (ARMLS). On an annual basis, the volume of previously-owned single-family homes are three to four times greater than new single-family home sales.

With year-over-year increases in sales and rising prices, 2017 should end as the best year for dollar sales volume since the record year of 2005. Dollar sales volume can be defined as the total sales price based upon the number of sales.

Dollar sales volume for past years show $26 billion in 2005, $13 billion in 2010 and $20 billion in 2016. The year 2017 will end around $21 to $22 billion, making it the second-best year for dollar sales volume.

Are Housing Prices Close to a Correction?    

Are we approaching another price correction since housing prices continue to increase? The chart below shows the annual median sale price since 2004.  In 2006, the sale price peaked at $279,000, then bottomed out at $125,000 in 2011. Looking at 2017, for the first nine months the median sale price is showing $264,000. Sometime in the second quarter of 2018, the median sale price may hit $280,000.

These are not inflation adjusted numbers. Starting with the year 2006 through the summer of 2017, inflation has been about 18 percent.

If we reach a median sale price of $280,000 in 2018, is it a sign of another price correction? My answer is no. Since 2013, the annual median sale price has increased between seven percent and eight percent each year, which reflects a healthy increase. At the same time, borrowers have been able to qualify for these higher prices, even in light of today’s strict lending standards when compared to 2004–2006.

The chart below compares the monthly median sale price from 2004 to 2005, as well as from 2016 to 2017.

As illustrated, the total sale price increase when comparing 2016 to 2017 on a month-to-month basis, shows a minimum increase of four percent (or $12,230) and a maximum increase of eight percent (or $19,000). Whereas, when comparing 2004 to 2005 on a month-to-month basis, the minimum increase was 27 percent (or $43,000) with a maximum increase hitting as high as 53 percent (or $96,000). Such a tremendous one year run-up in prices was not healthy or sustainable.

One explanation for the run-up in prices during 2004 to 2005 was a result of artificial demand caused by spec investors purchasing with 100 percent financing. Today, spec investors are required to put down 20 percent, which is one reason that I don’t believe we are headed for a price correction.

Let’s look at another reason.

2018 Predictions: Plenty of Demand to Own

2018 will experience fierce competition in many locations for available homes that are priced right, especially those in the mid-to-lower price ranges. The reason for the increased competition is more people, more jobs and tight inventory.

Maricopa County ranks number one for population growth compared to 3,142 counties in the United States — with 81,360 more people added. This number is based on the U.S. Census Bureau’s most recent 2017 numbers. Over half of this increase, or 43,189, comes from domestic migration. Compare Maricopa County to Cook County, where Chicago is located, which has the largest declining population for a county in the United States. Their domestic migration was a minus 66,244. The average daily increase in the population of Maricopa County was 222 people per day. I expect the same numbers or higher for next year.

During the real estate recession, Maricopa County lost approximately 235,000 jobs. Not only have those jobs come back, but an additional 75,000 jobs have been added since then. This job trend translates to more home buyers. Based on U.S. Department of Labor data, I estimate about 100 jobs are created each day in Maricopa County.

There are now more buyers in the Maricopa County market than ever before. Prices and demand will go up. In fact, I know of a lender that has prequalified a number of potential buyers who are ready to buy, but are unable to buy because of our tight inventory.

More buyers, tighter inventory and higher prices will make some homes on the market that don’t meet the expectation of an HGTV reality show look a bit better.

Stay tuned for a positive, single-family home market in 2018.

Fletcher R. Wilcox is the author of TheWilcoxReport.com and Vice President of Business Development for Grand Canyon Title. His market analysis has been referenced in the Wall Street Journal, Bloomberg News, HousingWire.com and National Mortgage News. Fletcher can be reached at FWilcox@GCTA.com and 602.648.1230.


West Valley Real Estate Event: Predictions for 2018 & How to Use Market Data With Your Clients & Appraisal Q & A!

          West Valley Real Estate Event  


Wednesday, November 1, 2017 from 10:30 a.m. to 12:00 p.m.

  • Predictions for 2018

  • How to use market data for credibility with your clients

  • 2017 real estate trends for sales, new listings, estimated months of supply

  • Compare home prices today and before the real estate recession

  • What month of the year has the highest sale price?

  • Appraisals and home values

  • What can you say to an appraiser?

  • What have you always wanted to ask an appraiser?

  • How much does solar increase value?

  • Bring your questions

Where: Cachet at the Wigwam

14200 W Village Pkwy #2256 Litchfield Park, AZ 85340

Realtors will tour Cachet’s beautiful single family homes, townhomes and condos.

Lunch served at 12:00 p.m.

RSVP to FWilcox@GCTA.com or 602.648.1230

Speakers

Fletcher R. Wilcox is V.P. of Business Development and a Real Estate Analyst at Grand Canyon Title. He grew up in Phoenix. Graduated from A.S.U. He is author of The Wilcox Report. His market analysis on the Greater Phoenix residential real estate market has been mentioned in the Wall Street Journal, Bloomberg News, MarketWatch, National Mortgage News, Housing Wire.com. Fletcher teaches residential contract writing for renewal hours and served on one of the three Arizona Association of REALTORS subcommittees for the February 2017 AAR Residential Resale Real Estate Purchase Contract.


Robert Oglesby is the Founder, President, and Chief Appraiser of AppraisalTek, a full service appraisal company that has established a reputation for providing high-quality appraisal services. Robert supervises all appraisal management operations for multiple large mortgage bankers and his company processes a high volume of appraisals every month. Robert employs and manages full-time employees, including staff appraisers and independent contractors. Robert is a LEED Green Associate, and active certified appraiser. In addition to his work at AppraisalTek, Robert organizes and presents professional seminars for real estate professionals.

     Sponsor


Scottsdale Report: Residential Real Estate Trends for April 2017. Estimated months of supply for single family homes and more!

This report is on Scottsdale sales and new listing trends for single family, apartment style, townhouse and patio homes.

The data was compiled from the Arizona Regional Multiple Listing Services, Inc. (ARMLS).

In April, of the four residential categories, single family homes had the most sales at 476 or 59% of all sales.  Second was Apartment Style / Flat homes with 161 sales.

Single Family Homes Estimated Months of Supply by Price Range

As can be seen in the table, homes in the lower price ranges generally have lower estimated months of supply.  Generally when there is a four month of supply or less it is considered a seller’s market.  Out of the 476 sales only ten were either a short sale or lender-owned sale.

April 2017

As can be seen, sales in three of the four categories were up this April over last April.  Townhouse sales had the greatest increase at 34%, while single family sales were down 4%.  Even though single family homes were down this April compared to last April, single family home sales are up ten percent for the first four months of 2017 (see the table below in the section Sales and New Listing Trends for the First Four Months of 2017).  

How did new monthly listings for the four categories compare in April 2017 to April 2016?

There were less new monthly listings in each of the four residential categories this April compared to last April.

Sales and New Listing Trends for the First Four Months of 2017

Below enter your email address to subscribe to this blog and receive notifications of new updates to The Wilcox Report by email.

Contact me to open your next escrow with our Scottsdale office located at 8520 E. Shea Blvd., Suite 115, 85260.

Fletcher R. Wilcox is the author of The Wilcox Report and Vice President of Business Development for Grand Canyon Title. His market analysis has been referenced in the Wall Street Journal, Bloomberg News, HousingWire.com and National Mortgage News. He served on one of Arizona Association of Realtor’s 2017 Residential Resale Contract subcommittees. He may be reached at FWilcox@GCTA.com  or by phone at 602-648-1230.

Recent media appearances

May 17, 2017 in the Phoenix Business Journal  http://www.bizjournals.com/phoenix/news/2017/05/11/existing-home-sales-highest-since-2006-up-18-over.html

May 12, 2017 KTAR    https://ktar.com/story/1570668/maricopa-county-home-sales-up-18-percent-near-prerecession-numbers/

Television interviews

My interview with Gerri Willis on the Fox Business News Network

Interview with Jim Belfiore on Square Off Arizona. Topic: The President and Housing.

Interview on Horizon on housing market.

First Quarter 2017: Residential Sales Volume Highest in Eleven Years!

First Quarter 2017 Results

Previously Owned Single Family Homes

Maricopa County  

Data compiled from the Arizona Regional Multiple Listing Services, Inc.

Sales volume in the first quarter of 2017 was the highest since 2006, which was before the great real estate recession. First quarter 2017 sales volume was 18.1% higher than the first quarter of 2016.

Sales volume for this report is the total of the sale prices for previously owned single family homes.  An example of  sales volume would if a real estate agents sold 20 homes and the sales price for each home was $250,000 their sales volume would be $5,000,000.

Sales volume is a health indicator of a real estate market.  It not only speaks on the number of sales, but also on their sale price.  It may show if prices are decreasing, flat, or increasing.  For example, in the first quarter of 2017 there were 15,622 sales for a sales volume of $5,016,013,713.  The average or mean sale price was $321,086.  Compare this to first quarter of 2012 when there were more sales, 16,405, but sales volume was lower, $3,144,327,127.  The average sale price then was $191,668.

The 2017 first quarter average sale price of $321,086 was $15,471 or 5% higher than the first quarter of 2016 average of $305,615.

A Formula for Price Increases

While sales were up 12.4% in the first quarter of 2017 year-over-year, new inventory was flat.  There were 1,726 more sales and 81 less new listings.

If the trend of more sales and less inventory continues prices will go up in the price ranges with heavy demand.

Coming soon will be the estimated months of supply by price range.

Below enter your email address to subscribe to this blog and receive notifications of new updates to The Wilcox Report by email.

Open your next escrow with our Scottsdale office located at 8520 E. Shea Blvd., Suite 115, 85260.

Fletcher R. Wilcox is the author of The Wilcox Report and Vice President of Business Development for Grand Canyon Title. His market analysis has been referenced in the Wall Street Journal, Bloomberg News, HousingWire.com and National Mortgage News. He served on one of Arizona Association of Realtor’s 2017 Residential Resale Contract subcommittees. He may be reached at FWilcox@GCTA.com  or by phone at 602-648-1230.

Television interviews

My interview with Gerri Willis on the Fox Business News Network

Interview with Jim Belfiore on Square Off Arizona. Topic: The President and Housing.

Interview on Horizon on housing market.


Who will be the top real agent, broker and more!

Old Town Scottsdale 2017 Friday Night Industry Party

Awards will be for

  • Residential real estate agent of the year
  • Residential real estate broker of the year
  • Residential rookie agent of the year
  • Residential team of the year
  • Commercial managing principal of the year
  • Commercial real estate broker of the year
  • Home inspector of the year
  • Certified appraiser of the year
  • Escrow officer of the year
  • Title sales representative of the year
  • Mortgage loan originator of the year

Arizona jobs projected to increase by 138,553 and Greater Phoenix jobs by 115,258. More jobs will keep the fire going for already hot housing market.

On March 9, the Arizona Office of Economic Opportunity released job projections.  Jobs in Arizona are projected to increase by 138,553 from the Second Quarter of 2016 through the Second Quarter of 2018.  The majority of the increase in jobs is expected to be in Greater Phoenix.  Jobs in Greater Phoenix are projected to increase by 115,258.  Greater Phoenix in this report is defined as Maricopa and Pinal counties.

This increase in jobs, along with a growing population, will continue to fuel the demand for residential housing.    Greater Phoenix is currently in the midst of a very hot demand for previously owned single family properties in many price ranges.

According to the Arizona Regional Multiple Listing Services, Inc., sales of previously owned single family homes in the first two months of 2017 are fourteen percent higher than for the same period last year.  The number of sales in January and February 2017 were 9,999 compared to 8,777 for the same period last year.

While sales are up inventory is down.  The number of previously owned new monthly listings in January and February 2017 were 5% or 860 less than for the same period last year.

When writing a contract, be prepared for your buyers to compete against multiple offers when a property is priced at market.

Expect prices to go up in many prices ranges.

The majority of the increase in jobs will be in Greater Phoenix 

To read the report go to https://laborstats.az.gov/sites/default/files/documents/files/ST_IndProjReport.pdf

2016-2018 Projected Job Growth by Region
Area Name 2016 Estimated Total Employment Level 2018 Projected Total Employment Level Numeric Growth Annualized Percentage Growth
Arizona 2,852,181 2,990,734 138,553 2.4%
Phoenix MSA1 2,051,434 2,166,692 115,258 2.8%
Tucson MSA2 382,515 392,583 10,068 1.3%
Balance Of State3 414,363 427,176 12,813 1.5%
1) Maricopa and Pinal Counties
2) Pima County 
3) All other areas in Arizona less Maricopa, Pinal, and Pima Counties 

Arizona’s industry employment projections are produced in conjunction with the U.S. Department of Labor (U.S. DOL), Employment and Training Administration (ETA).

Fletcher R. Wilcox is V.P. of Business Development and a Real Estate Analyst at Grand Canyon Title Agency.

He is author of www.TheWilcoxReport.com. His market analysis on residential real estate in Greater Phoenix has been mentioned in the Wall Street Journal, Bloomberg News, MarketWatch, HousingWire.com, National Mortgage News, Arizona Republic and the Phoenix Business Journal. He has been a guest speaker on local radio and both local and national TV.

He teaches real estate agents strategies on marketing and instructs real estate classes in residential contract writing and Arizona title procedures.  Fletcher started snowboarding in 2006. He is not very good.

Fletcher may be reached at mailto:FWilcox@GCTA.com  602.648.1230

When Is The Peak Season For New Listings And Sales? Fourth Quarter 2016 New Listings And Sales Should Be Higher than Last Year!

This is an update of an article published on July 20, 2016. This version includes third quarter 2016 new monthly listings and sales.  The information in this report is from the Arizona Regional Multiple Listing Services, Inc.

Real estate agents make their commissions as listing agents and as selling agents. So at what times of the year are agents the busiest listing seller’s properties and closing on sales with buyers?  What times of the year are listings and sales the slowest?

I researched the number of new listings and sales for previously owned single family homes in Maricopa County, Arizona (sometimes defined as the Greater Phoenix Market). I broke down the years 2014, 2015 and 2016 into quarters.  The data is from the Arizona Multiple Listing Services, Inc. (ARMLS).

The Findings

image001New Listings: Which Quarter Had the Most and the Least?

The first quarter, the winter quarter, had the most new listings. Then like a stair step, the number of new listings declines in each of the following quarters.  In both 2014 and 2015 the fourth quarter had considerable less new listings than the first quarter.  Then as the chart below shows, new listings shoot up again in the first quarter of the New Year.

What is significant in 2016? More Sellers Listing Their Homes.

So far in 2016, more homes have been listed than in either 2015 or 2014. For the first three quarters of 2016 there were 66,544 new listings compared to 63,216 in 2015 and 63,404 in 2014.  So new monthly listings in 2016 are approximately five percent higher than in either 2015 or 2014.

oct-2016-new-listings-by-q

Sales: Which Quarter Had the Most and Least?

Sold Sign


While the first quarter has the most new listings, the second quarter has the most sales – at least in 2014 and 2015. The chart below shows single family sales.  In 2014, the quarter with the least number of sales was the first quarter.  In 2015, it was a toss-up for the least number of sales between the first quarter and the fourth quarter.  There were only thirty-six more closings in the fourth quarter over the first quarter in 2015.  The second best quarter for sales has been the third quarter.

What is significant in 2016? More Sales! Higher Prices!

Sales in the first three quarters of 2016 broke the 50,000 mark. There were 50,050 sales compared to 48,117 in 2015 and 43,510 in 2014.  So sales were 4.0% higher than in 2015 and 15.1% than 2014.  What may be more significant is the sales price.  The median sales price in 2016 for the first three quarters is $249,900 compared to $233,000 in 2015 and $217,000 in 2014.

oct-2016-sales-by-q

oct-2016-median-sales-price

Don’t Stop Working in the Fourth Quarter!

While new listings and sales generally slow-down in the fourth quarter, there will still be plenty of activity. New listings and sales should exceed last year’s fourth quarter results and will end around 18,000 listings with sales close to 14,000!

Fletcher Wilcox 2016 picture

Fletcher R. Wilcox is V.P. of Business Development and a Real Estate Analyst at Grand Canyon Title Agency.

He is author of www.TheWilcoxReport.com. His market analysis on residential real estate in Greater Phoenix has been mentioned in the Wall Street Journal, Bloomberg News, MarketWatch, HousingWire.com, National Mortgage News, Arizona Republic and the Phoenix Business Journal. He has been a guest speaker on local radio and both local and national TV.

He teaches real estate agents strategies on marketing and instructs real estate classes in residential contract writing and Arizona title procedures.  Fletcher started snowboarding in 2006. He is not very good.

Fletcher may be reached at FWilcox@GCTA.com  602.648.1230

New-GCTA-Logo

What time of the year are there the most new listings and the most real estate sales? A review of the numbers in Greater Phoenix.

 When are Real Estate Agents the Busiest?

By

Fletcher R. Wilcox

Grand Canyon Title Agency

Real estate agents make their commissions as listing agents and as selling agents. So at what times of the year are agents the busiest listing seller’s homes and closing on sales with buyers? What times of the year are listings and sales the slowest? Does real estate activity really slow down in the hot summer months?

So, what I did was research the number of new listings and sales for existing single family homes in Maricopa County, Arizona.  I broke down the years 2014, 2015 and the first half of 2016 into quarters. The data is from the Arizona Multiple Listing Services, Inc. (ARMLS).

The Findings

image001

New Listings: Which Quarter Had the Most and the Least?

In both 2014, 2015 and in the first half of 2016 we saw the same pattern for new listings. The first quarter, the winter quarter, had the most new listings. Then like a stair step, the number of new listings declines in each of the following quarters with the fourth quarter having considerable less new listings than the first quarter. Then as the chart below shows, listings shoot up again in the first quarter of the New Year.

More New Listings and Sales in First-Half of 2016 Than in Either 2014 or 2015

When comparing the number of new listings in the first two quarters of 2016 there were 2,792 more new listings than 2015 and 1,280 than 2014. This increase in inventory along with job growth and population growth and boomerang buyers has fueled home ownership. There were 1,268 more sales in the first two quarters of 2016 than 2015 and a whopping 4,243 more sales than 2014.

image001


Sales

Sales: Which Quarter Had the Most and Least?

While the first quarter has the most new listings, the second quarter has the most sales. The chart below shows single family sales. In 2014, the quarter with the least number of sales was the first quarter. In 2015, it was a toss-up for the least number of sales between the first quarter and the fourth quarter. There were only thirty-six more closings in the fourth quarter over the first quarter. The second best quarter for sales has been the third quarter.

There are More Sales in the Hot Summer Months Than You Might Think

If we compare sales in the third quarter, the hot weather months of July, August and September, to the best quarter, the second quarter, we saw a decline in sales of 12% in both 2015 and 2014.

However, the third quarter has been the second best quarter for sales. In 2015, third quarter sales were 18% higher than in both the first and fourth quarters.

image002

Conclusions

In recent history, the first and second quarters of the year had the most new listings followed by the second and third quarters as the most sales. While real estate sales slow-down in the hot weather third quarter compared to the spring second quarter, the third quarter has been the number two quarter for most sales. While sales in the first and fourth quarters are the slowest, there is still lots of sales activity. Data shows sales in the first and fourth quarters range between 12,000 and 14,000. Look for sales in the fourth quarter of  2016 to be over 14,000 sales.

Fletcher Wilcox 2016 picture

Fletcher R. Wilcox is V.P. of Business Development and a Real Estate Analyst at Grand Canyon Title Agency.

He is author of www.TheWilcoxReport.com. His market analysis on residential real estate in Greater Phoenix has been mentioned in the Wall Street Journal, Bloomberg News, MarketWatch, HousingWire.com, National Mortgage News, Arizona Republic and the Phoenix Business Journal. He has been a guest speaker on local radio and both local and national TV.

He teaches real estate agents strategies in marketing and instructs real estate renewal classes in residential contract writing and Arizona title procedures.  Fletcher started snowboarding in 2006. He is not very good.

Fletcher may be reached at FWilcox@GCTA.com  602.648.1230