This is an update of an article published on July 20, 2016. This version includes third quarter 2016 new monthly listings and sales. The information in this report is from the Arizona Regional Multiple Listing Services, Inc.
Real estate agents make their commissions as listing agents and as selling agents. So at what times of the year are agents the busiest listing seller’s properties and closing on sales with buyers? What times of the year are listings and sales the slowest?
I researched the number of new listings and sales for previously owned single family homes in Maricopa County, Arizona (sometimes defined as the Greater Phoenix Market). I broke down the years 2014, 2015 and 2016 into quarters. The data is from the Arizona Multiple Listing Services, Inc. (ARMLS).
The Findings
 New Listings: Which Quarter Had the Most and the Least?
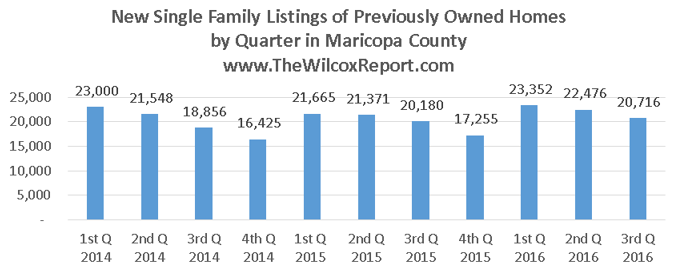
The first quarter, the winter quarter, had the most new listings. Then like a stair step, the number of new listings declines in each of the following quarters. In both 2014 and 2015 the fourth quarter had considerable less new listings than the first quarter. Then as the chart below shows, new listings shoot up again in the first quarter of the New Year.
What is significant in 2016? More Sellers Listing Their Homes.
So far in 2016, more homes have been listed than in either 2015 or 2014. For the first three quarters of 2016 there were 66,544 new listings compared to 63,216 in 2015 and 63,404 in 2014. So new monthly listings in 2016 are approximately five percent higher than in either 2015 or 2014.
Sales: Which Quarter Had the Most and Least?
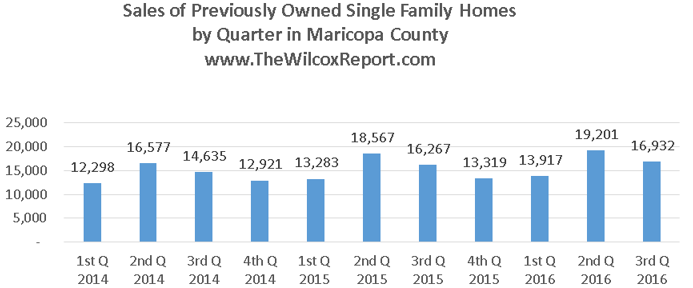
While the first quarter has the most new listings, the second quarter has the most sales – at least in 2014 and 2015. The chart below shows single family sales. In 2014, the quarter with the least number of sales was the first quarter. In 2015, it was a toss-up for the least number of sales between the first quarter and the fourth quarter. There were only thirty-six more closings in the fourth quarter over the first quarter in 2015. The second best quarter for sales has been the third quarter.
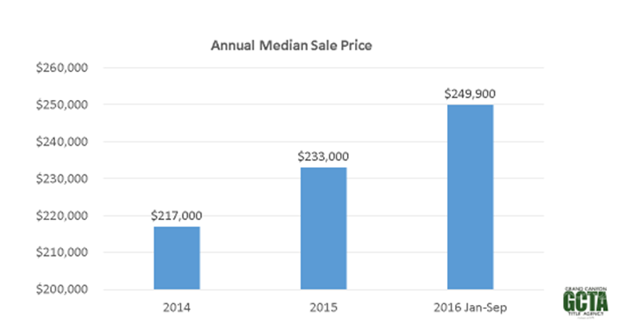
What is significant in 2016? More Sales! Higher Prices!
Sales in the first three quarters of 2016 broke the 50,000 mark. There were 50,050 sales compared to 48,117 in 2015 and 43,510 in 2014. So sales were 4.0% higher than in 2015 and 15.1% than 2014. What may be more significant is the sales price. The median sales price in 2016 for the first three quarters is $249,900 compared to $233,000 in 2015 and $217,000 in 2014.
Don’t Stop Working in the Fourth Quarter!
While new listings and sales generally slow-down in the fourth quarter, there will still be plenty of activity. New listings and sales should exceed last year’s fourth quarter results and will end around 18,000 listings with sales close to 14,000!

Fletcher R. Wilcox is V.P. of Business Development and a Real Estate Analyst at Grand Canyon Title Agency.
He is author of www.TheWilcoxReport.com. His market analysis on residential real estate in Greater Phoenix has been mentioned in the Wall Street Journal, Bloomberg News, MarketWatch, HousingWire.com, National Mortgage News, Arizona Republic and the Phoenix Business Journal. He has been a guest speaker on local radio and both local and national TV.
He teaches real estate agents strategies on marketing and instructs real estate classes in residential contract writing and Arizona title procedures. Fletcher started snowboarding in 2006. He is not very good.
Fletcher may be reached at FWilcox@GCTA.com 602.648.1230

![]()


Follow Fletcher