Residential Market Update
March 2018
Arizona School of Real Estate & Business

Fletcher R. Wilcox
Fletcher R. Wilcox is the founder and author of TheWilcoxReport.com and Vice President of Business Development for Grand Canyon Title. His market analysis has been referenced in the Wall Street Journal, Bloomberg News, HousingWire.com and National Mortgage News. Fletcher can be reached at FWilcox@GCTA.com and 602.648.1230.

This report reviews trends for previously owned single family homes in Maricopa County. The information is compiled from the Arizona Regional Multiple Listing Services, Inc. known as ARMLS.
Strong Start in 2018 for Sales and Median Sale Price but not for New Listing Inventory
January 2018 sales of 4,404 were up three percent over January 2017 and February 2018 sales of 5,026 were up 7.7 percent over February 2017. The median sale price in January 2018 of $273,000 was $21,635 or 8.6% higher than January 2017. The median sale price in February 2018 of $276,000 was $21,500 or 8.4% higher than February 2017. New monthly listings, however, did not perform as well. There were 7,393 new listings in January 2018 which were just 61 more than January 2017, while February 2018 had 6,907 new listings which were 311 or 4.3% less than February 2017.
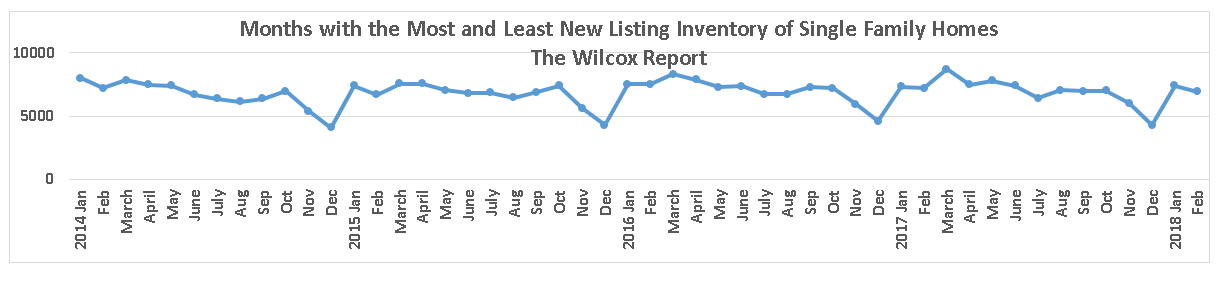
Which Months May Have the Most and the Least New Monthly Listings?
New monthly listings are defined as the number of homes listed with ARMLS in a particular month. The line chart below shows the number of new monthly listings, month by month, starting January 2014 through February 2018. We see similar patterns in each year. At a certain time in the year the chart forms a V pattern. The bottom of the V is December when the least number of sellers put their homes on the market giving buyers the least number of choices. Then new listings skyrocket in January which is the beginning of the listing season. In January 2018 new monthly listings of 7,387 were 3,109 more or 42% higher than in December 2017. In February new monthly listings go down a little from January because it is a shorter month, then they go up in March. March for the last four years is the month with the highest number of new monthly listings. After March the number of new monthly listings generally goes down then goes up in again October. After October the number of new listings go straight down forming the bottom of the V.
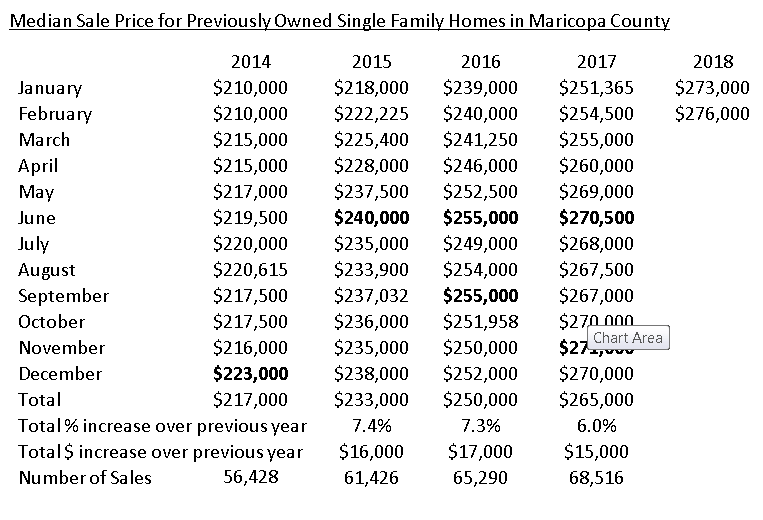
Which Months May Have the Highest and the Lowest Median Sale Price?
The table below shows the median sale price, month-by-month, from January 2014 through February of 2018. I define the sale price date as the day of close of escrow which occurs when the deed is recorded. All of these years show January as the month with the lowest sale price with the only exception February 2014 when it was the same as January 2014. The years 2015, 2016 and 2017 all start the first half of the year with a similar trend. January starts the year with the lowest sale price for the year. It then increases five consecutive months until June. Then after June there is a July sale price drop. The July 2015 drop from June 2015 was 2.1%. In 2016 it was 2.3% and about 1% in 2017. The month(s) with the highest sale price from 2014 through 2017 were the following: In 2014 it was December at $223,000. In 2015 it was June at $240,000. In 2016 June and September were tied at $255,000. In 2017 it was June at $270,500 until November eclipsed it at $271,000.
For each of the years — by the end of the year — the sale price was always higher than the beginning. In 2014 the December sale price was 6.2% higher than January. In 2015 it was 9.2%, in 2016 5.4% and 7.4% in 2017.
Sometime in 2018 the sale price most likely will surpass the highest month ever which was June 2006 when it reached $287,500.
Conclusion
These trends apply to properties in Maricopa County as a whole and may or may not apply to a specific property. This where a real estate agent comes in. An agent can do a market analysis of a specific property to determine how it compares to the overall trends, and then explain to their customer if these trends apply.
There is one thing that I know that does apply to real estate in Maricopa County. Selling and buying real estate in 2018 will be another exciting year to be in the business!


Follow Fletcher