2019 The Year of Competition & Opportunity

2018 Results — 2019 Predictions

The Residential Real Estate Market in Greater Phoenix (Maricopa County)

By

Fletcher R. Wilcox

V.P. Business Development & Real Estate Analyst

Grand Canyon Title

FWilcox@gcta.com 602.648.1230

This article was published January 29, 2019 in the Arizona Journal of Real Estate & Business

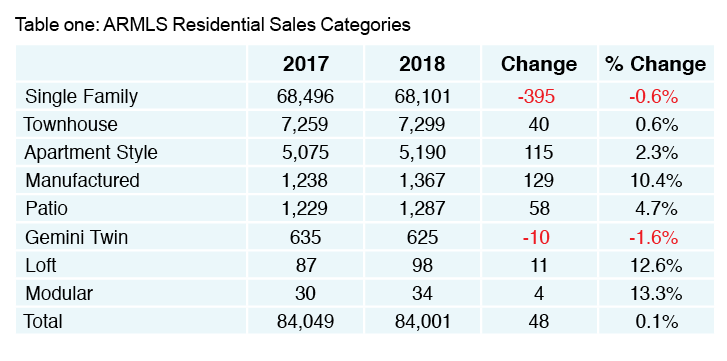
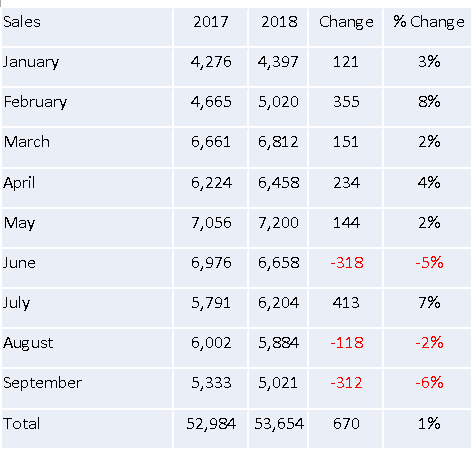
The total number of residential sales in 2018 was equal to the number of sales in 2017. According to data from The Arizona Regional Multiple Listing Services, Inc. known as ARMLS, sales in Maricopa County (Greater Phoenix) in 2018 were 84,001 compared to 84,049 in 2017. When the number of sales are broken down by the eight ARMLS residential categories there were some small year-over-year differences. The only two categories in 2018 that were down year-over-year were single family and gemini twin sales. Single family sales were down 395 or less than one percent and gemini twin sales were down 10 sales or 1.6 percent. The other six categories accounted for 357 more sales in 2018 over 2017. See Table One.

Single Family Sales

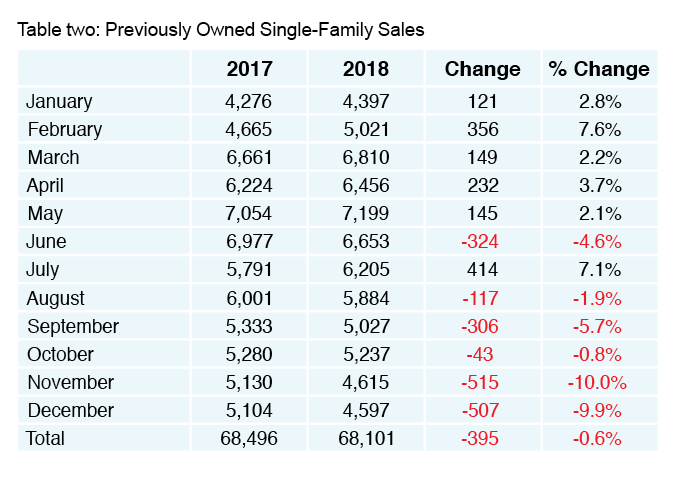
Let’s review the residential category that by far had the most sales. Previously owned single family home sales in both 2017 and 2018 were over seventy-five percent of all ARMLS residential sales. When comparing previously owned single family sales year-over-year by month there was a difference the first part of 2018 compared to the last part of the year. From January through June there were 679 more sales compared to the same time last year. Then from July through December there were 1,071 less sales compared to 2017. See Table two.
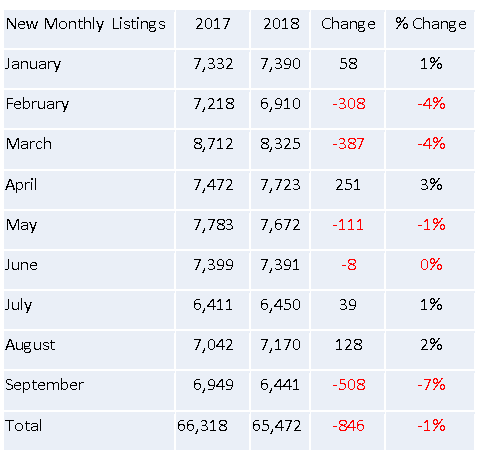
New Listings

Previously Owned Single Family Homes Overall new listings were slightly down in 2018 compared to 2017. There were 82,682 new listings in 2018 compared to 83,616 for a decrease of one percent or 934 new listings. For the number of sales to increase in 2019 there will have to be an increase in new listing inventory in the most desired price ranges. Expect fierce competition amongst real estate agents for listings in the most popular price ranges.

Median Purchase Price

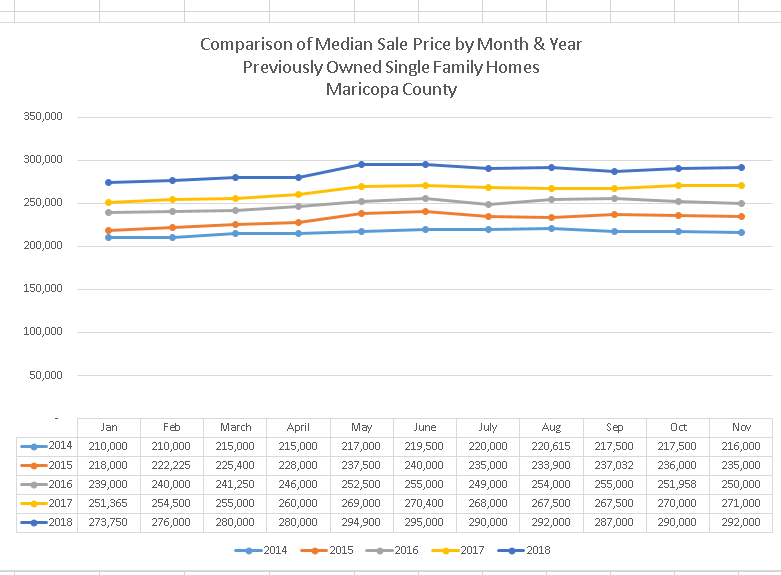
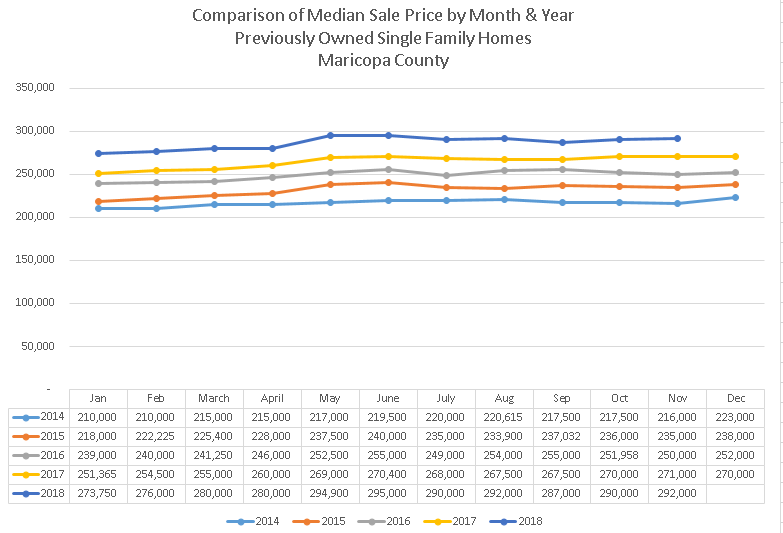
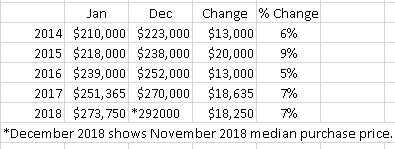
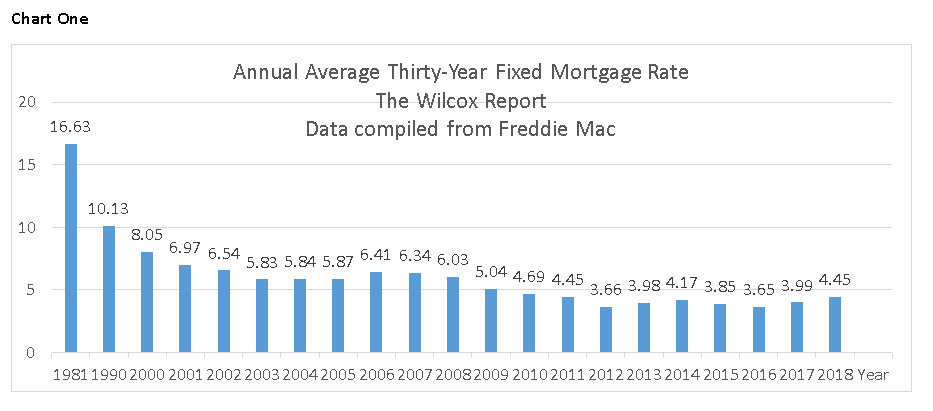
Previously Owned Single Family Homes In 2018 the median purchase price for a previously owned single family home in Maricopa County reached an all-time high. Last May it reached $294,900 surpassing the pre-real estate recession high of $287,500 in June 2006. Sometime in the second quarter of 2019 it most likely will be over $300,000. Chart one shows the median purchase price for a previously owned single family home month by month for the last five years. As seen in the chart, the median purchase is always higher for the same month in the following year. In 2019 this trend should continue. The continual rise in the median purchase price means that there are very few homes still underwater in 2018. There were approximately 350 short sales in 2018, according to ARMLS data. There should be even less in 2019. Of course while rising home prices increase household wealth they decrease affordability, making it more difficult for potential first time homebuyers to purchase.                                     Chart one

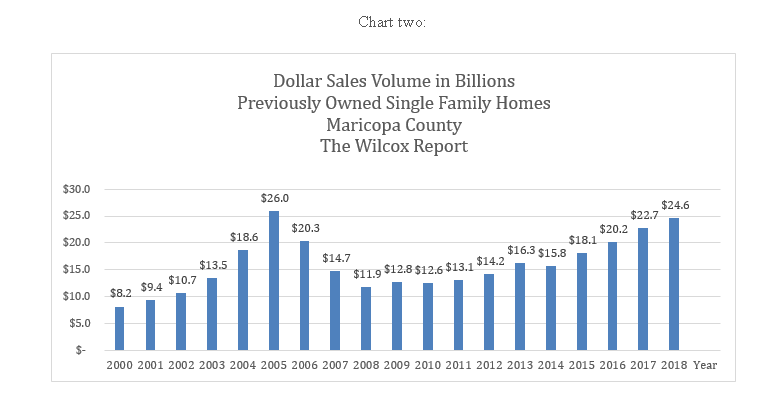
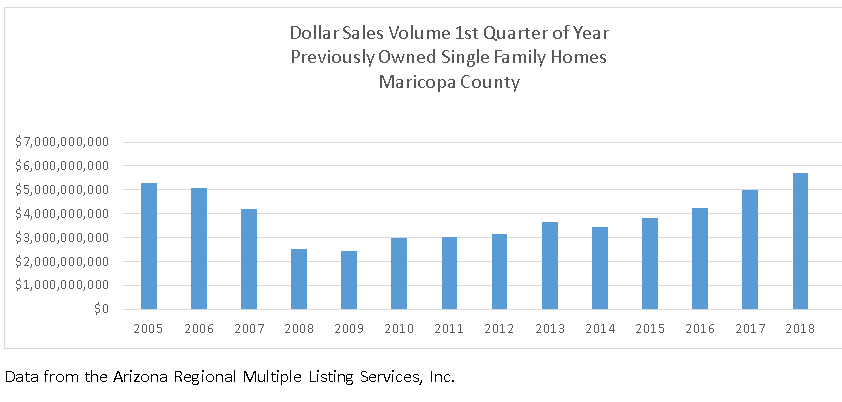
Dollar Sales Volume Dollar sales volume for previously owned single family homes in Maricopa County is the highlight of 2018! According to ARMLS data the 2018 dollar sales volume of $24.6 billion represents the total purchase prices of the 68,101 sales in 2018. See Chart two. Only one previous year has finished with a higher dollar sales volume. That was in 2005 when it was $26 billion represented by 78,419 sales. High dollar sales volume and the number of residential sales in Maricopa County are probably the main reasons new real estate companies, some with disruptive business models, have opened offices in Maricopa County. Because of the many different real estate companies and thousands of real estate agents in Maricopa County expect there to be fierce competition amongst them in 2019 for sellers and buyers.

Competition in 2019

The competition in 2019 amongst real estate companies for sellers and buyers will not be the only battleground. Loan officers will be in competition for qualified buyers. Qualified buyers will in competition for priced right listings.

Competition amongst loan officers for purchase business will increase in 2019 because of higher mortgage rates. For the last few years low interest rates have boomed the number of people refinancing into a lower mortgage rate. Refinances provided considerable business for loan officers. Because of the low number of households now refinancing a great portion of loan officer business is wiped out. Because of this, more loan officers will be going after the same purchase business.

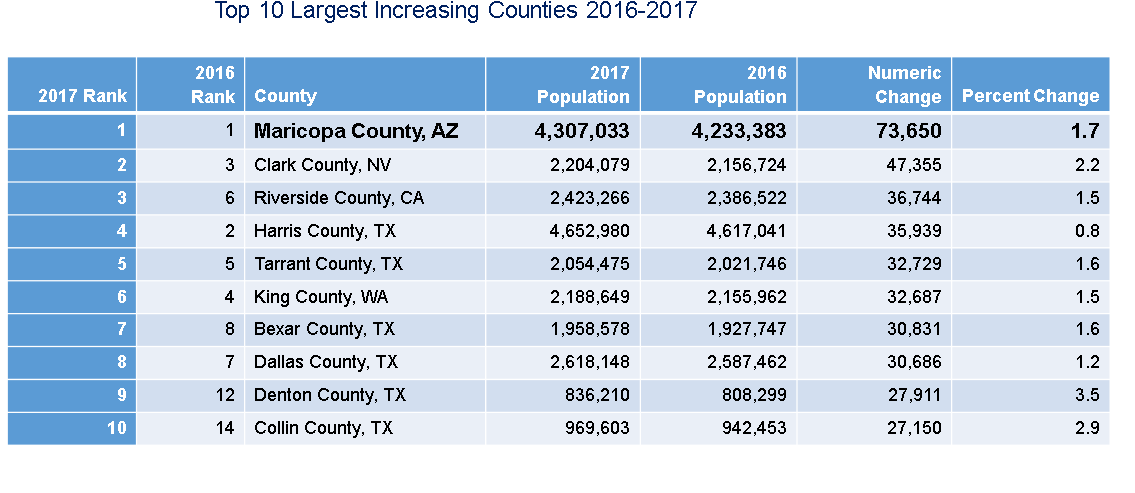
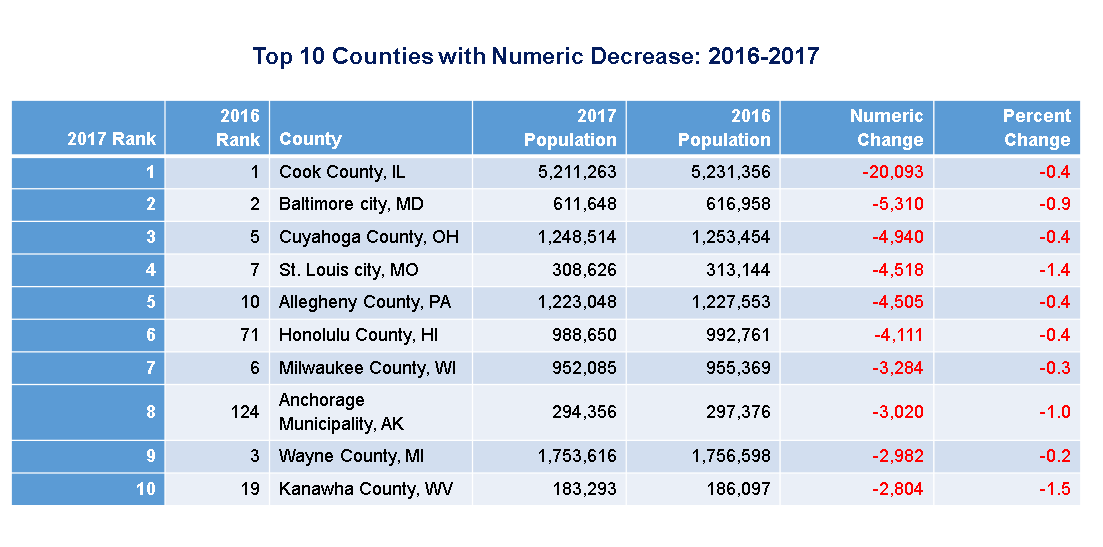
Competition amongst buyers will increase in 2019 because the number of buyers is increasing. Why? More people moving to Maricopa County. According to the U.S. Census Bureau Maricopa County for the last two years gained more people than any other county in the United States. The population of Maricopa County has increased by 155,000 the last two years. Prediction: when U.S. Census data comes out in 2019 Maricopa County for the third year in a row will be the number one county for increase in population.

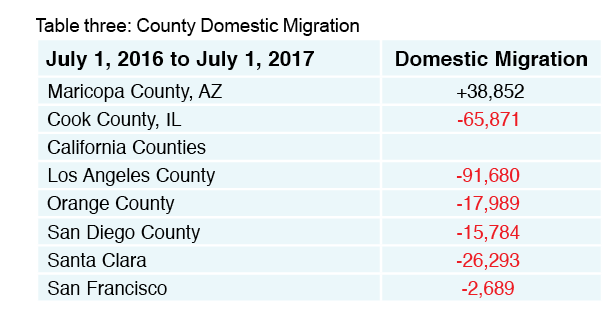
A major reason why Maricopa County’s population will continue to grow is the exodus of people and companies from states that have high taxes and difficult business regulations, and/or have very cold weather, and/or have a political environment that people feel is no longer friendly. Below in Table three is the most recent domestic migration data from the U.S. Census Bureau. Maricopa County’s domestic migration was a net 38,852. Cook County, where Chicago is located, domestic migration was a negative 65,871 people. Los Angeles County lost 91,680 to domestic migration. A popular destination for people leaving Los Angeles County is Maricopa County. When the U.S. Census Bureau releases its 2019 migration data, we should see similar patterns as shown in Table three.

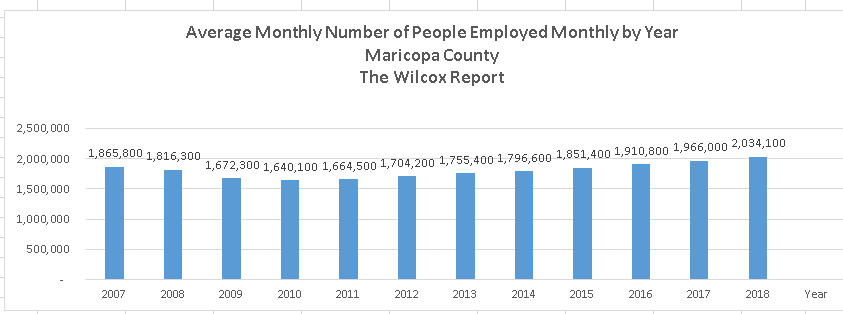
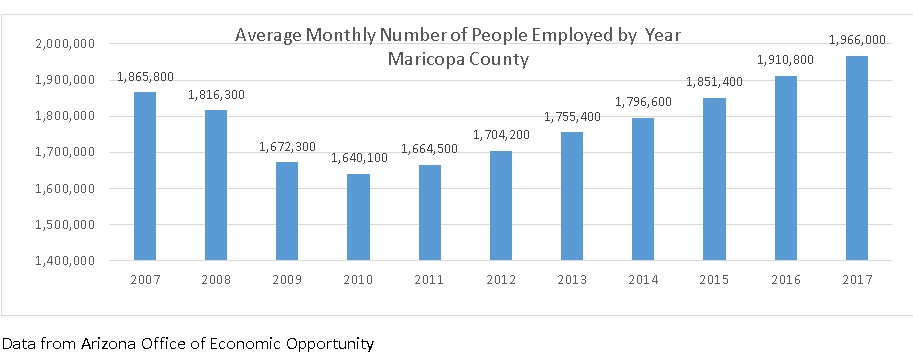
Along with the increase in population has been an increase in jobs. The number of people employed in Maricopa County has gone up substantially the last five years. In 2018 there were 272,600 more people employed than in 2013. By the end of 2019 there should be an additional 65,000 to 70,000 more people employed which will add to the number of people whom will either rent or own.

With a growing number of people employed and with a limited number of priced right listings, the presentation of a buyer’s offer must stand out to be successful.

So Want Does a Real Estate Agent Need to do to be Competitive in 2019?

In 2019 real estate companies with large advertising budgets will be advertising reasons why potential sellers and buyers should work with them. Some will sell technology, some will sell convenience, and others will sell discounts. So as a real estate agent you need to make as many contacts with potential sellers and buyers as you can. Be prepared to give them compelling reasons why they should use you as their agent! If today someone asked you why should I use you as my agent what would be your response? Have a system in place to keep in touch with future clients and past clients. Increase the probability of sellers and buyers picking you as their agent by applying the social psychology principles of persuasion to both your social media and one on one meetings. These principles are Authority, Social Proof and Liking.

Sellers and buyers want relevant real estate information. People defer to those whom have knowledge on real estate trends and are able to communicate trends effectively. This creates authority. People tend to do things they see other people doing. This is social proof. Make it known when you get a listing or close a home with a buyer. Spread the word of your successes with client testimonials. Liking is when someone likes you, they sense you like them and you have things in common. When someone likes you, you have a greater chance of them saying yes to your requests.

All in all, because of population and job growth in Maricopa County, 2019 should be a great year, but competitive year, to be a real estate agent!

Fletcher Wilcox is V.P. of Business Development and a Real Estate Analyst at Grand Canyon Title Agency. Grand Canyon Title Agency is a member of the Fidelity National Financial (FNF) family of companies. They are the nation’s largest group of title companies and title insurance underwriters. FNF is ranked 293 on the FORTUNE 500® list of America’s largest companies.  He may be reached at FWilcox@gcta.com  602.648.1230 

Fletcher is the founder of The Wilcox Report. His market analysis on residential real estate in Greater Phoenix has been mentioned in publications such as the Wall Street Journal, MarketWatch, Bloomberg News, HousingWire.com, National Mortgage News, the Arizona Republic and the Phoenix Business Journal. He has been a guest speaker on both local and national TV and radio.

He served on one of the three Arizona Association of REALTORS® subcommittees which made recommendations for changes to the 2017 AAR Residential Resale Real Estate Purchase Contract. For more than fifteen years he has taught classes at the Arizona School of Real Estate & Business. He teaches renewal hours in contract law and legal issues. He is a member of the Arizona State Escrow Association, the Arizona Association of REALTORS, the Scottsdale Area Association of REALTORS and is a board member and V.P. of Networking for the Arizona Mortgage Lenders Association.  He often speaks at the Heart of Scottsdale REALTOR Marketing Session.

For eleven years he served as a citizen board member on the Phoenix Police Department’s Disciplinary Review & Use of Force Boards. He is a past board member of Alice Cooper’s Solid Rock Teen Center. Fletcher started snowboarding in 2006 and is not very good.

Why January And February May Be The Best Months Of A Year To Buy A Home!

If the cost of a home is important to a buyer or if appreciation is important to a buyer now may be the best time to write an offer!

Why?  In each of the last five years the month that had the lowest median purchase price of the year was the month of January.  This is a topic I have written about before, but I want to remind everyone that January can be a good month for buyers to close on a home.

This can be seen in Chart One.  Chart One shows the median purchase price for a previously owned single family home in Maricopa County for each month from January 2014 through November 2018. The majority of homes that close in January went under contract in December.

Table One shows the appreciation at the beginning of the year compared to the end of the year.  It compares the January median purchase price to the December median purchase price for the last four years, except for 2018 which shows the median purchase price for November.  At the end of the last five years the median purchase price was from five percent to nine percent higher compared to the beginning of the year.  For example, the median purchase price in January 2018 was $273,750.  In November it was $292,000 seven percent or $18,250 higher than in January.

What if a buyer missed closing in January but will close in February?  Chart One shows that February is the month with the second lowest median purchase price of the year!

So if price and appreciation are important to a buyer now may be the best time to write an offer with a January or February closing.

A point to remember is that for both Chart One and Table One the information is for previously owned single family homes in Maricopa County.  Any city, or zip code, or subdivision within Maricopa County may trend differently.

May you have a Merry Christmas and a Happy New Year!

Fletcher R. Wilcox

V.P. Business Development, Real Estate Analyst & Author of www.TheWilcoxReport.com

A report on real estate, lending, population and job growth trends in Greater Phoenix.

Grand Canyon Title Agency

FWilcox@GCTA.com

602.648.1230

Grand Canyon Title Agency is a wholly owned subsidiary of the Fortune 302 company FNF


Chart One

Table One

A Historic Review of the Thirty-Year Fixed Mortgage Rate. Remember when it was 16%?

THE WILCOX REPORT

By

Fletcher R. Wilcox

V.P. Business Development, Grand Canyon Title Agency

FWILCOX@GCTA.com  602.648.1230

This report was published in the November 2018 edition of the Arizona Journal of Real Estate & Business 

Mortgage Rates in Perspective: Do You Remember How High Rates Used to Be?

Since 1971 Freddie Mac has tracked the thirty-year fixed mortgage rate. Chart One shows a partial history of their tracking.  The year with the highest annual average thirty-year fixed mortgage rate was in 1981 when it was 16.63 percent.  In 1990 it was 10.13 percent.  At the turn of the century it was 8.05 percent.  The annual average thirty-year fixed mortgage rate from 2012 through 2017 was under four percent for five of these six years.  The year it was the lowest since 1971 was 2016 when it was 3.65.

In 2018 the monthly average thirty-year fixed mortgage rate was over four percent every month from January through September. The September 2018 thirty-year fixed mortgage rate of 4.62 percent is the highest rate in seven years.  It is expected to continue to increase due to the strong economy, tax cuts and expectations for increases in inflation.

There is an alternative to get a lower mortgage rate than what the thirty-year fixed mortgage rate has to offer. It is the 5/1 adjustable rate mortgage known as the 5/1 ARM.  For the first five years this mortgage rate is fixed at a lower rate than the thirty-year fixed rate.  Then after five years it adjusts once a year.  Eventually the 5/1 ARM could go higher than the thirty-year fixed rate.  Chart Two compares the 5/1 ARM to the thirty-year fixed rate for the first nine months of 2018.   It shows that in September the 5/1 ARM rate was slightly below four percent at 3.93 percent compared to 4.62 percent for the thirty year fixed mortgage rate.

While increases in mortgage rates equates to consumers paying more in monthly principle and interest some consumers will be able to offset these increases due to a rise in their personal income. Personal income in Arizona was up 3.8 percent in the second quarter of 2018.

A Mortgage Payment Today is Less Expensive than in Previous Real Estate Boom

In 2018 the median purchase price finally surpassed the all-time high median purchase price record set in 2006. In 2006 the annual median purchase price was $279,900, for a previously owned single family home in Maricopa County, compared to $285,500 thus far in 2018.  However, a mortgage payment in 2018 is still cheaper when compared to 2006.  The principle and interest payment for a thirty-year fixed mortgage in 2006 for the median purchase price of $279,900 with ten percent down was $1,577 compared to $1,320 in 2018 for a median purchase price of $285,500 with ten percent down.  The difference being the thirty-year fixed mortgage rate.  In 2006 it was 6.41 percent compared to 4.62 percent in September 2018.

Sales and New Monthly Listings for Previously Owned Single Family Homes in Greater Phoenix

Sales of previously owned single family homes in Greater Phoenix (Maricopa County) were down six percent in September 2018 compared to September 2017, but up were up 1% overall for the first nine months of 2018 compared to 2017. New monthly listings of previously owned single family homes were down seven percent in September 2018 compared to September 2017 and were down one percent overall for the first nine months of 2018 compared to the same time period last year.

Conclusion

Sales of previously owned single family homes in Greater Phoenix are down for the last three out of four months compared to the same time period last year. It is my opinion that this is due primarily to lack of inventory and not as much the increase in mortgage rates.  However, mortgage rates most likely will continue to rise because of the strong economy.  It would not be a surprise over the next few months for the thirty-year fixed rate to hit five percent and the 5/1 ARM to hit four percent.

Fletcher R. Wilcox

V.P. Business Development, Real Estate Analyst & Author of www.TheWilcoxReport.com

A report on real estate, lending and job growth trends in Greater Phoenix.

Grand Canyon Title Agency

FWIlcox@GCTA.com

602.648.1230


Commercial Real Estate Seminar Friday October 26! Find out about jobs and population!

https://www.asreb.com/programs/seminars/

Join us Friday, October 26th from 9:00AM – 12:30PM for our Commercial Real Estate Seminar!

During this seminar, local industry experts will discuss the following:

  • How many jobs have been created in Arizona over the last year
  • Why the commercial real estate market is on fire
  • Why Amazon and other large companies coming to Arizona
  • Why target companies in San Francisco and Silicon to move to Arizona.
  • The future of the retail shopping centers
  • Development of apartment complexes and the growth of our population

Join moderator, Fletcher Wilcox, and our panelists, as they discuss Commercial Real Estate in Arizona. Seats are limited and often sell out, so register today for this seminar you won’t want to miss!

Luxury Home Seminar September 28 at the Arizona School of Real Estate!

WHY RENT WHEN YOU CAN OWN — BUT WHAT IF I CANNOT FIND ANYTHING TO OWN?

Arizona Journal of Real Estate & Business

Fletcher Wilcox

V.P. Business Development & Real Estate Analyst, Grand Canyon Title Agency

FWilcox@GCTA.com   602.648.1230

THE MOST DESIRED REAL ESTATE PRODUCT TO OWN OR RENT IS A SINGLE-FAMILY HOME 

There are 1,043,000 single-family properties in Maricopa County, sometimes called the Greater Phoenix area. Single-family properties are by far the most popular residential product to own. Over 80 percent of sales this year on the Arizona Regional Multiple Listing Service, Inc. (known as ARMLS) were single-family homes. Owning single-family homes for rent is also popular. Twenty-six percent, or 273,000, of the single-family homes in Maricopa County show up in the county records as non-owner occupied.

PURCHASE PRICES AND RENTAL PRICES STEADILY INCREASING FOR SINGLE-FAMILY HOMES

The chart below shows the median purchase price and the median monthly rental price for years 2000 through 2018 for Maricopa County. The median purchase price has increased seven consecutive years while the median monthly rental price has increased five consecutive years since 2013. The monthly median purchase price and rental price in May 2018 were the highest they have ever been at $294,000 and $1,595, respectively.

The demand to either own or rent a single-family home is due to a growing population, more jobs, and higher wage earnings, while supply has not kept up. New home building is making a comeback, but for years its growth was stunted because of the real estate recession.

WHICH IS GOING UP FASTER: PURCHASE PRICE OR RENTAL PRICE?

Table 1 shows the median year-over-year changes by month for both purchase and rental prices for the first five months of 2017 and 2018. Purchase prices have increased between eight and ten percent while rental prices are up between four and seven percent.

When comparing January 2018 to May 2018, we find the purchase price up $21,000, or eight percent, and the rental price up $160 per month, or 11 percent. Of course, if I owned my home, my appreciation since the beginning of the year would be up around $21,000. If I rented, I would not have asset appreciation — just a rent increase.

Table 1. Median Purchase and Rental Price Year-Over-Year Changes by Month, Jan. to May 2017 & 2018

COMPARING A MORTGAGE PAYMENT TO A RENTAL PAYMENT

Table 2 features scenarios comparing a monthly mortgage payment to a monthly rental payment. Monthly mortgage payments were estimated using the May 2018 median purchase price of $294,000 with five different down payment amounts and two types of conventional loans. The May 2018 median rental payment of $1,595 is the number to which these monthly mortgage payments are compared.

The two loan types are a 30-year fixed with an interest rate of 4.66% and a 5/1 adjustable-rate mortgage (ARM) with an interest rate of 3.87%. Both rates were quoted on Freddie Mac’s website on May 24. A 5/1 ARM is a loan with a fixed rate for the first five years. In the sixth year, the rate may adjust higher and may increase every year thereafter. For each mortgage payment category, in addition to principal and interest, I added mortgage insurance for loans with down payments of less than 20 percent. I also added monthly payments of $100 for property taxes and $50 for homeowner’s insurance to every payment category. These are only estimates.

Table 2. Sales and Median Sale Price, April 2017 vs. April 2018

Of course, there are many factors to consider when it comes to deciding whether to own or rent. When owning, you may have a monthly HOA fee. Renters have to pay a monthly rental tax of one to three percent (depending on the city) on their rental price and should pay for renter’s insurance. How long do you plan on staying in the home? What is the probability of a job relocation? What kind of home repairs may be needed if you own? Also, consider the equity you stand to gain if you own, but won’t if you rent.

WHY RENT WHEN YOU CAN OWN — BUT WHAT IF I CANNOT FIND ANYTHING TO OWN?

Why pay rent when you can own? and Why pay your landlord’s mortgage? have been popular lines of ad copy for years now, but they seem to overlook the challenge of locking down a purchase in today’s competitive single-family home market. My advice to buyers: do not give up! Be prepared and persevere! Get loan pre-approval through a lender for a house in your price range. Pick an area you would like to live in and learn everything you can about it. Meet with a real estate agent and get trend information on inventory, days on market, sales, and prices. And when a home that meets your needs hits the market, don’t wait — write the offer! Contact me if you need a recommendation for a real estate agent or a lender. Whatever you do, do not give up on owning!


Fletcher R. Wilcox

Fletcher is the founder of The Wilcox Report. His market analysis on residential real estate in Greater Phoenix has been mentioned in publications such as the Wall Street Journal, MarketWatch, Bloomberg News, HousingWire.com, National Mortgage News, the Arizona Republic and the Phoenix Business Journal. He has been a guest speaker on both local and national TV and radio.

He gives insight to real estate agents on how to use real estate statistics for influence with sellers and buyers.  He teaches contract law renewal hours for Arizona real estate agents.

Fletcher may be reached at FWilcox@GCTA.com  602.648.1230

Grand Canyon Title Agency is a wholly owned subsidiary of the Fortune 293 company FNF


Contract Law Class in New $2,148,650 Staged Home in the heart of Scottsdale by Cachet Homes!

Wednesday, June 27 10:00 a.m. to 1:00 p.m.


Custom features include: Sierra Pacific wood windows and doors, Sub-Zero, Wolf and Asko appliances, a completed resort style rear yard including a pool, spa, outdoor fireplace and BBQ. 4,478 sq. ft. includes 4 bedrooms, 4 1/2 baths, game room, den.


When: June 27 from 10:00 a.m. to 1:00 p.m.

This is a complementary class and lunch by Cachet Homes. Come early and tour Cachet Homes newest custom home at Fox Haven.


Where: 10333 N 79th Way, Scottsdale, 85258

While on Hayden go West on Gold Dust which is one block south of Shea Blvd.

and then turn right on 79thWay.


RSVP to FWilcox@GCTA.com or mailto:sgoodrich@cachethomes.net

CONTRACT TO CLOSING: CONTINGENCIES, CLAUSES & CURES

Three hours of contract law continuing education

INTERNAL DYNAMICS SCHOOL OF REAL ESTATE

Class taught by Fletcher R. Wilcox, V.P. Grand Canyon Title. Fletcher served on one of the Arizona Association of REALTORS subcommittees which made recommendations to the February 2017 AAR Residential Resale Real Estate Contract.

Record First Quarter Due to Population, Job and Wage Increases.

May 2018

Residential Market Update

Published in Arizona Journal of Real Estate & Business

Fletcher R. Wilcox

Fletcher R. Wilcox is the author of TheWilcoxReport.com. He is V. P. of Business Development and a Real Estate Analyst for Grand Canyon Title Agency. Fletcher can be reached at FWilcox@GCTA.com and 602.648.1230.


2018 Dollar Sales Volume Hits All-Time High for a First Quarter

Strong demand to own a home in the first quarter of 2018 led to the highest dollar sales volume ever for a first quarter.  The previous first quarter with the highest dollar sales volume was in 2005.  First quarter dollar sales volume for both 2005 and 2018 was over five billion dollars with 2018 being 445 million higher than 2005.  Dollar sales volume measures the strength or weakness of a market.  It is comprised by adding the sale price of each sale for a total.  The dollar sales volume in this report is for previously owned single family home sales in Maricopa County.  Previously owned single family home sales are eighty percent of residential sales making it the most popular residential product for buyers.

When comparing first quarter 2018 to first quarter 2017 there were 16,227 sales in 2018 which was four percent higher than the 15,602 sales in 2017. The median sale price in first quarter 2018 was $277,000 compared to $255,000 in 2017 for a five percent increase.

Demand to Own Fueled by Population, Job and Wage Growth

Population Growth: According to the U.S. Census Bureau Maricopa County for the second year in a row was ranked the number one county with the greatest increase in population.  The population of Maricopa County increased by 73,650 in the 2017 rankings, or 202 people a day.  Finishing second was Clark County, Nevada with a population increase of 47,355 or 130 per day.

Job Growth: In 2007 there were 1,865,800 people employed in Maricopa County.  Three years later in 2010 – there were 225,700 less people working.  Back then many people that lost their jobs stopped making their mortgage payments.  Mortgage payments not made lead to foreclosure notices.  Foreclosures notices lead to cheap REO sales driving down home values.  This is far from the situation today.  In 2017 there were 325,900 more people employed than in 2010.  With a growing number of employed people, and since everyone has to live somewhere, the sheer number of employed people creates a lot of competition for existing inventory.  Prediction: By the end of 2018, the average monthly number of people employed will be over 2,000,000 per month for the first-time!

Rising Wages: At the time of writing this article only wage information for Arizona was available.  Maricopa County which is located in Arizona has seventy-one percent of all employed workers in the state.  According to the U.S. Bureau of Economic Analysis the average state earnings for the fifty states increased 3.1% in 2017.  Earnings are defined as wages and salaries.  Arizona earnings were above average.  Arizona had the third highest earnings at 4.8 percent, behind only Idaho and Washington.  Leading Arizona’s earnings was healthcare with an increase of 6.4 percent.

Conclusion

There is a lot of news that positively affects the Maricopa County real estate market. Population, job and wage growth should continue to increase.  These increases will keep the fierce competition amongst buyers for single family homes at the most popular price ranges.  Also, because of the sheer dollar sales volume of the market, expect increased competition amongst real estate companies as more of them, some with new business models, enter our market for a piece of the dollar action.  I do expect 2018 will end as one of the best years ever for the Maricopa County real estate market.

Fletcher R. Wilcox

Fletcher R. Wilcox is the author of TheWilcoxReport.com. He is V. P. of Business Development and a Real Estate Analyst for Grand Canyon Title Agency. Fletcher can be reached at FWilcox@GCTA.com and 602.648.1230.

Maricopa County Does It Again! Leads All Counties In the U.S. For Net Population Gain!

Maricopa County Does It Again!

May 4, 2018
By Fletcher R. Wilcox author of The Wilcox Report
V.P. Business Development & Real Estate Analyst
Grand Canyon Title Agency   FWilcox@gcta.com  602.648.1230

According to the U.S. Census Bureau Maricopa County for the second year in a row was ranked the number one county with the greatest increase in population.  The population of Maricopa County increased by 73,650 in the 2017 rankings, or 202 people a day.  Finishing second was Clark County, Nevada with a population increase of 47,355 or 130 per day.  The county with the greatest net loss of people was Cook County, Illinois.  Its population decreased by 20,093.

This increase in the population of Maricopa County will continue to fuel the demand for housing!

Below are the top ten counties for increasing and decreasing population.

Fletcher R. Wilcox is the author of TheWilcoxReport.com. He is V. P. of Business Development and a Real Estate Analyst at Grand Canyon Title Agency. His market analysis has been referenced in the Wall Street Journal, Bloomberg News, HousingWire.com and National Mortgage News.  He teaches real estate agents how to use market data for influence with sellers and buyers.  To contact him to speak at an event Fletcher may be reached at FWilcox@GCTA.com and 602.648.1230.


CYBERSECURITY SEMINAR: LOTS OF TOPICS COVERED. THE FBI WILL ADDRESS YOUR CYBERSECURITY.

REGISTER

SEE TOPICS BELOW!