WHY RENT WHEN YOU CAN OWN — BUT WHAT IF I CANNOT FIND ANYTHING TO OWN?

Arizona Journal of Real Estate & Business

Fletcher Wilcox

V.P. Business Development & Real Estate Analyst, Grand Canyon Title Agency

FWilcox@GCTA.com   602.648.1230

THE MOST DESIRED REAL ESTATE PRODUCT TO OWN OR RENT IS A SINGLE-FAMILY HOME 

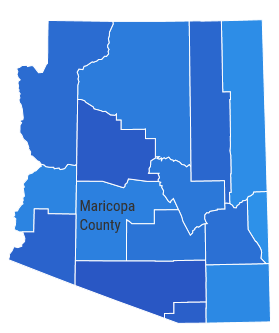
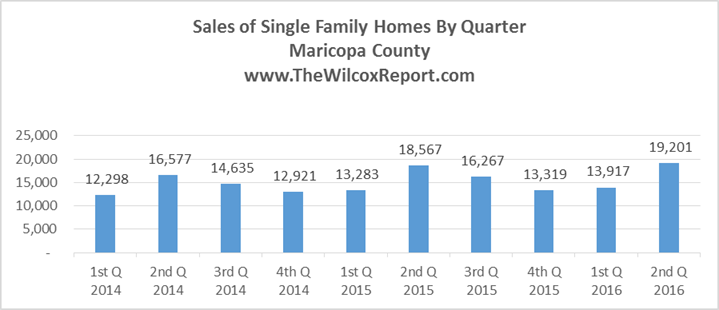
There are 1,043,000 single-family properties in Maricopa County, sometimes called the Greater Phoenix area. Single-family properties are by far the most popular residential product to own. Over 80 percent of sales this year on the Arizona Regional Multiple Listing Service, Inc. (known as ARMLS) were single-family homes. Owning single-family homes for rent is also popular. Twenty-six percent, or 273,000, of the single-family homes in Maricopa County show up in the county records as non-owner occupied.

PURCHASE PRICES AND RENTAL PRICES STEADILY INCREASING FOR SINGLE-FAMILY HOMES

The chart below shows the median purchase price and the median monthly rental price for years 2000 through 2018 for Maricopa County. The median purchase price has increased seven consecutive years while the median monthly rental price has increased five consecutive years since 2013. The monthly median purchase price and rental price in May 2018 were the highest they have ever been at $294,000 and $1,595, respectively.

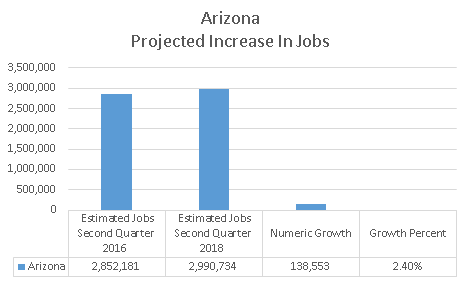
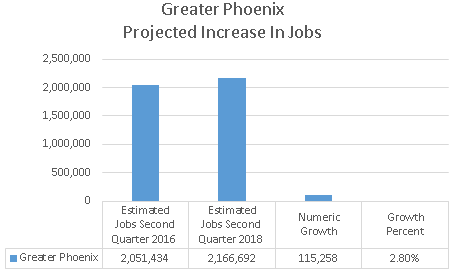
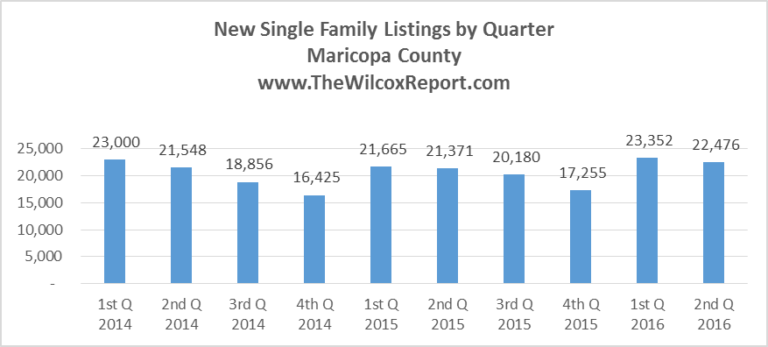
The demand to either own or rent a single-family home is due to a growing population, more jobs, and higher wage earnings, while supply has not kept up. New home building is making a comeback, but for years its growth was stunted because of the real estate recession.

WHICH IS GOING UP FASTER: PURCHASE PRICE OR RENTAL PRICE?

Table 1 shows the median year-over-year changes by month for both purchase and rental prices for the first five months of 2017 and 2018. Purchase prices have increased between eight and ten percent while rental prices are up between four and seven percent.

When comparing January 2018 to May 2018, we find the purchase price up $21,000, or eight percent, and the rental price up $160 per month, or 11 percent. Of course, if I owned my home, my appreciation since the beginning of the year would be up around $21,000. If I rented, I would not have asset appreciation — just a rent increase.

Table 1. Median Purchase and Rental Price Year-Over-Year Changes by Month, Jan. to May 2017 & 2018

COMPARING A MORTGAGE PAYMENT TO A RENTAL PAYMENT

Table 2 features scenarios comparing a monthly mortgage payment to a monthly rental payment. Monthly mortgage payments were estimated using the May 2018 median purchase price of $294,000 with five different down payment amounts and two types of conventional loans. The May 2018 median rental payment of $1,595 is the number to which these monthly mortgage payments are compared.

The two loan types are a 30-year fixed with an interest rate of 4.66% and a 5/1 adjustable-rate mortgage (ARM) with an interest rate of 3.87%. Both rates were quoted on Freddie Mac’s website on May 24. A 5/1 ARM is a loan with a fixed rate for the first five years. In the sixth year, the rate may adjust higher and may increase every year thereafter. For each mortgage payment category, in addition to principal and interest, I added mortgage insurance for loans with down payments of less than 20 percent. I also added monthly payments of $100 for property taxes and $50 for homeowner’s insurance to every payment category. These are only estimates.

Table 2. Sales and Median Sale Price, April 2017 vs. April 2018

Of course, there are many factors to consider when it comes to deciding whether to own or rent. When owning, you may have a monthly HOA fee. Renters have to pay a monthly rental tax of one to three percent (depending on the city) on their rental price and should pay for renter’s insurance. How long do you plan on staying in the home? What is the probability of a job relocation? What kind of home repairs may be needed if you own? Also, consider the equity you stand to gain if you own, but won’t if you rent.

WHY RENT WHEN YOU CAN OWN — BUT WHAT IF I CANNOT FIND ANYTHING TO OWN?

Why pay rent when you can own? and Why pay your landlord’s mortgage? have been popular lines of ad copy for years now, but they seem to overlook the challenge of locking down a purchase in today’s competitive single-family home market. My advice to buyers: do not give up! Be prepared and persevere! Get loan pre-approval through a lender for a house in your price range. Pick an area you would like to live in and learn everything you can about it. Meet with a real estate agent and get trend information on inventory, days on market, sales, and prices. And when a home that meets your needs hits the market, don’t wait — write the offer! Contact me if you need a recommendation for a real estate agent or a lender. Whatever you do, do not give up on owning!


Fletcher R. Wilcox

Fletcher is the founder of The Wilcox Report. His market analysis on residential real estate in Greater Phoenix has been mentioned in publications such as the Wall Street Journal, MarketWatch, Bloomberg News, HousingWire.com, National Mortgage News, the Arizona Republic and the Phoenix Business Journal. He has been a guest speaker on both local and national TV and radio.

He gives insight to real estate agents on how to use real estate statistics for influence with sellers and buyers.  He teaches contract law renewal hours for Arizona real estate agents.

Fletcher may be reached at FWilcox@GCTA.com  602.648.1230

Grand Canyon Title Agency is a wholly owned subsidiary of the Fortune 293 company FNF


Maricopa County Does It Again! Leads All Counties In the U.S. For Net Population Gain!

Maricopa County Does It Again!

May 4, 2018
By Fletcher R. Wilcox author of The Wilcox Report
V.P. Business Development & Real Estate Analyst
Grand Canyon Title Agency   FWilcox@gcta.com  602.648.1230

According to the U.S. Census Bureau Maricopa County for the second year in a row was ranked the number one county with the greatest increase in population.  The population of Maricopa County increased by 73,650 in the 2017 rankings, or 202 people a day.  Finishing second was Clark County, Nevada with a population increase of 47,355 or 130 per day.  The county with the greatest net loss of people was Cook County, Illinois.  Its population decreased by 20,093.

This increase in the population of Maricopa County will continue to fuel the demand for housing!

Below are the top ten counties for increasing and decreasing population.

Fletcher R. Wilcox is the author of TheWilcoxReport.com. He is V. P. of Business Development and a Real Estate Analyst at Grand Canyon Title Agency. His market analysis has been referenced in the Wall Street Journal, Bloomberg News, HousingWire.com and National Mortgage News.  He teaches real estate agents how to use market data for influence with sellers and buyers.  To contact him to speak at an event Fletcher may be reached at FWilcox@GCTA.com and 602.648.1230.


Which months have the highest and lowest sale prices?

Residential Market Update

March 2018

Arizona School of Real Estate & Business

Fletcher R. Wilcox

Fletcher R. Wilcox is the  founder and author of TheWilcoxReport.com and Vice President of Business Development for Grand Canyon Title. His market analysis has been referenced in the Wall Street Journal, Bloomberg News, HousingWire.com and National Mortgage News. Fletcher can be reached at FWilcox@GCTA.com and 602.648.1230.

This report reviews trends for previously owned single family homes in Maricopa County. The information is compiled from the Arizona Regional Multiple Listing Services, Inc. known as ARMLS.

Strong Start in 2018 for Sales and Median Sale Price but not for New Listing Inventory

January 2018 sales of 4,404 were up three percent over January 2017 and February 2018 sales of 5,026 were up 7.7 percent over February 2017. The median sale price in January 2018 of $273,000 was $21,635 or 8.6% higher than January 2017.  The median sale price in February 2018 of $276,000 was $21,500 or 8.4% higher than February 2017.  New monthly listings, however, did not perform as well.  There were 7,393 new listings in January 2018 which were just 61 more than January 2017, while February 2018 had 6,907 new listings which were 311 or 4.3% less than February 2017.

Which Months May Have the Most and the Least New Monthly Listings?

New monthly listings are defined as the number of homes listed with ARMLS in a particular month. The line chart below shows the number of new monthly listings, month by month, starting January 2014 through February 2018.  We see similar patterns in each year.  At a certain time in the year the chart forms a V pattern.  The bottom of the V is December when the least number of sellers put their homes on the market giving buyers the least number of choices.  Then new listings skyrocket in January which is the beginning of the listing season.  In January 2018 new monthly listings of 7,387 were 3,109 more or 42% higher than in December 2017.  In February new monthly listings go down a little from January because it is a shorter month, then they go up in March.  March for the last four years is the month with the highest number of new monthly listings.  After March the number of new monthly listings generally goes down then goes up in again October.  After October the number of new listings go straight down forming the bottom of the V.

Which Months May Have the Highest and the Lowest Median Sale Price?

The table below shows the median sale price, month-by-month, from January 2014 through February of 2018. I define the sale price date as the day of close of escrow which occurs when the deed is recorded.  All of these years show January as the month with the lowest sale price with the only exception February 2014 when it was the same as January 2014.   The years 2015, 2016 and 2017 all start the first half of the year with a similar trend.  January starts the year with the lowest sale price for the year.  It then increases five consecutive months until June.  Then after June there is a July sale price drop.  The July 2015 drop from June 2015 was 2.1%.  In 2016 it was 2.3% and about 1% in 2017.   The month(s) with the highest sale price from 2014 through 2017 were the following:  In 2014 it was December at $223,000.  In 2015 it was June at $240,000.  In 2016 June and September were tied at $255,000.  In 2017 it was June at $270,500 until November eclipsed it at $271,000.

For each of the years — by the end of the year — the sale price was always higher than the beginning. In 2014 the December sale price was 6.2% higher than January.  In 2015 it was 9.2%, in 2016 5.4% and 7.4% in 2017.

Sometime in 2018 the sale price most likely will surpass the highest month ever which was June 2006 when it reached $287,500.


Conclusion

These trends apply to properties in Maricopa County as a whole and may or may not apply to a specific property. This where a real estate agent comes in.  An agent can do a market analysis of a specific property to determine how it compares to the overall trends, and then explain to their customer if these trends apply.

There is one thing that I know that does apply to real estate in Maricopa County. Selling and buying real estate in 2018 will be another exciting year to be in the business!

Home Prices Keep Going Up in Greater Phoenix!

It has been a long time since the median sale price for a previously owned single family home was this high.

May 2017 Results  

The median sale price for a previously owned single family home in May was $269,000. The last time the sale price was at the $269,000 level was almost ten years ago.  It was August of 2007.

The data in this report was compiled from the Arizona Regional Multiple Listing Services, Inc.  The geographic area is Greater Phoenix (Maricopa County).

The May 2017 median sale price represented a year-over-year increase of 6.5% or $16,500 compared to May 2016 when it was $252,500. This is a healthy increase.  See Table A.

A Brief History of Median Sale Price

The first time in Maricopa County history that the median sale price of a previously owned single family home reached the May 2017 level was in June 2005. Back then the year-over-year increase was not 6.5% or even close.  It was 47.1% or $86,500.  It went from $183,500 in June 2004 to $270,000 in June 2005.  See Table B.

The May median sale price of $269,000 has come a long way since August 2011 when it bottomed at $120,000. But it still has a little way to go to reach the peak month of $287,500 in June 2006.

Sales in May 2017

May 2017 sales were up 9.5% or by 614 compared to May 2016. Additionally, May 2017 sales were up 13.3% or by 834 over April 2017.  Compare this to May 2016 sales which were up 5.4% or by 332 over April 2016.  See Table C.

New Monthly Listings in May 2017

May 2017 new monthly listings had the highest year-over-year increase for a month this year. There were 466 more listings that hit the market this May than last May.  This jump in inventory most likely will help keep up sales momentum in June and July.

Overall, the number of new monthly listings is flat when comparing the number for the first five months of 2017 to 2016. See total in Table D.

Estimated Months of Supply by Price Point

It is a seller’s market for homes priced under $600,000 (as long as they are priced right). For all price points under $600,000 the estimated months of supply is under four months.  The price range with the highest number of sales was $200,000 to $249,999.  The estimated months of supply in this range was one month.  See Table E.


Fletcher R. Wilcox is V.P. of Business Development and a Real Estate Analyst at Grand Canyon Title Agency.
He is author of www.TheWilcoxReport.com. His market analysis on residential real estate in Greater Phoenix has been referenced in the Phoenix Business Journal, the Wall Street Journal, Bloomberg News, MarketWatch, HousingWire.com, National Mortgage News, and the Arizona Republic. He has been a guest speaker on local radio and both local and national TV.
He teaches real estate agents marketing strategies and teaches residential contract writing and Arizona title procedures. He served on one of the subcommittees at the Arizona Association of REALTORS subcommittees making recommendations on changes to the February 2017 AAR Residential Resale Real Estate Purchase Contract. Fletcher started snowboarding in 2006. He is not very good.   Fletcher may be reached at FWilcox@GCTA.com  602.648.1230

Grand Canyon Title Agency conveniently located in the heart of Scottsdale!

Our Scottsdale office is located just west of the 101 at 8520 E. Shea Blvd, suite 115, 85260.

If you already work with a Grand Canyon Title escrow officer thank you! Keep on working with them.  If not, stop in and see us!

Meet our escrow officers:

Faye Berumen Manager and Escrow Officer  mailto:FBerumen@gcta.COM   602.474.5136

Dawn Siddoway Escrow Officer  mailto:Dawn.Siddoway@GCTA.com   480-200-0371

Maureen Wilcox Escrow Officer mailto:MWilcox@GCTA.com   602.474.5138

Remember to write Grand Canyon Title on line 117 of the Contract!

At this location we have renewal hours and training in sales and marketing!

Fletcher R. Wilcox

V.P. Business Development

Real Estate Analyst

Grand Canyon Title Agency

A Division of FNTA

 FWIlcox@GCTA.com   602.648.1230

Fletcher R. Wilcox is the author of The Wilcox Report and Vice President of Business Development for Grand Canyon Title. His market analysis has been referenced in the Wall Street Journal, Bloomberg News, HousingWire.com and National Mortgage News. He served on one of Arizona Association of Realtor’s 2017 Residential Resale Contract subcommittees. He may be reached at FWilcox@GCTA.com  or by phone at 602-648-1230.

Recent media appearances

May 17, 2017 in the Phoenix Business Journal  http://www.bizjournals.com/phoenix/news/2017/05/11/existing-home-sales-highest-since-2006-up-18-over.html

May 12, 2017 KTAR    https://ktar.com/story/1570668/maricopa-county-home-sales-up-18-percent-near-prerecession-numbers/

Television interviews

My interview with Gerri Willis on the Fox Business News Network

Interview with Jim Belfiore on Square Off Arizona. Topic: The President and Housing.

Interview on Horizon on housing market.

Scottsdale Report: Residential Real Estate Trends for April 2017. Estimated months of supply for single family homes and more!

This report is on Scottsdale sales and new listing trends for single family, apartment style, townhouse and patio homes.

The data was compiled from the Arizona Regional Multiple Listing Services, Inc. (ARMLS).

In April, of the four residential categories, single family homes had the most sales at 476 or 59% of all sales.  Second was Apartment Style / Flat homes with 161 sales.

Single Family Homes Estimated Months of Supply by Price Range

As can be seen in the table, homes in the lower price ranges generally have lower estimated months of supply.  Generally when there is a four month of supply or less it is considered a seller’s market.  Out of the 476 sales only ten were either a short sale or lender-owned sale.

April 2017

As can be seen, sales in three of the four categories were up this April over last April.  Townhouse sales had the greatest increase at 34%, while single family sales were down 4%.  Even though single family homes were down this April compared to last April, single family home sales are up ten percent for the first four months of 2017 (see the table below in the section Sales and New Listing Trends for the First Four Months of 2017).  

How did new monthly listings for the four categories compare in April 2017 to April 2016?

There were less new monthly listings in each of the four residential categories this April compared to last April.

Sales and New Listing Trends for the First Four Months of 2017

Below enter your email address to subscribe to this blog and receive notifications of new updates to The Wilcox Report by email.

Contact me to open your next escrow with our Scottsdale office located at 8520 E. Shea Blvd., Suite 115, 85260.

Fletcher R. Wilcox is the author of The Wilcox Report and Vice President of Business Development for Grand Canyon Title. His market analysis has been referenced in the Wall Street Journal, Bloomberg News, HousingWire.com and National Mortgage News. He served on one of Arizona Association of Realtor’s 2017 Residential Resale Contract subcommittees. He may be reached at FWilcox@GCTA.com  or by phone at 602-648-1230.

Recent media appearances

May 17, 2017 in the Phoenix Business Journal  http://www.bizjournals.com/phoenix/news/2017/05/11/existing-home-sales-highest-since-2006-up-18-over.html

May 12, 2017 KTAR    https://ktar.com/story/1570668/maricopa-county-home-sales-up-18-percent-near-prerecession-numbers/

Television interviews

My interview with Gerri Willis on the Fox Business News Network

Interview with Jim Belfiore on Square Off Arizona. Topic: The President and Housing.

Interview on Horizon on housing market.

First Quarter 2017: Residential Sales Volume Highest in Eleven Years!

First Quarter 2017 Results

Previously Owned Single Family Homes

Maricopa County  

Data compiled from the Arizona Regional Multiple Listing Services, Inc.

Sales volume in the first quarter of 2017 was the highest since 2006, which was before the great real estate recession. First quarter 2017 sales volume was 18.1% higher than the first quarter of 2016.

Sales volume for this report is the total of the sale prices for previously owned single family homes.  An example of  sales volume would if a real estate agents sold 20 homes and the sales price for each home was $250,000 their sales volume would be $5,000,000.

Sales volume is a health indicator of a real estate market.  It not only speaks on the number of sales, but also on their sale price.  It may show if prices are decreasing, flat, or increasing.  For example, in the first quarter of 2017 there were 15,622 sales for a sales volume of $5,016,013,713.  The average or mean sale price was $321,086.  Compare this to first quarter of 2012 when there were more sales, 16,405, but sales volume was lower, $3,144,327,127.  The average sale price then was $191,668.

The 2017 first quarter average sale price of $321,086 was $15,471 or 5% higher than the first quarter of 2016 average of $305,615.

A Formula for Price Increases

While sales were up 12.4% in the first quarter of 2017 year-over-year, new inventory was flat.  There were 1,726 more sales and 81 less new listings.

If the trend of more sales and less inventory continues prices will go up in the price ranges with heavy demand.

Coming soon will be the estimated months of supply by price range.

Below enter your email address to subscribe to this blog and receive notifications of new updates to The Wilcox Report by email.

Open your next escrow with our Scottsdale office located at 8520 E. Shea Blvd., Suite 115, 85260.

Fletcher R. Wilcox is the author of The Wilcox Report and Vice President of Business Development for Grand Canyon Title. His market analysis has been referenced in the Wall Street Journal, Bloomberg News, HousingWire.com and National Mortgage News. He served on one of Arizona Association of Realtor’s 2017 Residential Resale Contract subcommittees. He may be reached at FWilcox@GCTA.com  or by phone at 602-648-1230.

Television interviews

My interview with Gerri Willis on the Fox Business News Network

Interview with Jim Belfiore on Square Off Arizona. Topic: The President and Housing.

Interview on Horizon on housing market.


Arizona jobs projected to increase by 138,553 and Greater Phoenix jobs by 115,258. More jobs will keep the fire going for already hot housing market.

On March 9, the Arizona Office of Economic Opportunity released job projections.  Jobs in Arizona are projected to increase by 138,553 from the Second Quarter of 2016 through the Second Quarter of 2018.  The majority of the increase in jobs is expected to be in Greater Phoenix.  Jobs in Greater Phoenix are projected to increase by 115,258.  Greater Phoenix in this report is defined as Maricopa and Pinal counties.

This increase in jobs, along with a growing population, will continue to fuel the demand for residential housing.    Greater Phoenix is currently in the midst of a very hot demand for previously owned single family properties in many price ranges.

According to the Arizona Regional Multiple Listing Services, Inc., sales of previously owned single family homes in the first two months of 2017 are fourteen percent higher than for the same period last year.  The number of sales in January and February 2017 were 9,999 compared to 8,777 for the same period last year.

While sales are up inventory is down.  The number of previously owned new monthly listings in January and February 2017 were 5% or 860 less than for the same period last year.

When writing a contract, be prepared for your buyers to compete against multiple offers when a property is priced at market.

Expect prices to go up in many prices ranges.

The majority of the increase in jobs will be in Greater Phoenix 

To read the report go to https://laborstats.az.gov/sites/default/files/documents/files/ST_IndProjReport.pdf

2016-2018 Projected Job Growth by Region
Area Name 2016 Estimated Total Employment Level 2018 Projected Total Employment Level Numeric Growth Annualized Percentage Growth
Arizona 2,852,181 2,990,734 138,553 2.4%
Phoenix MSA1 2,051,434 2,166,692 115,258 2.8%
Tucson MSA2 382,515 392,583 10,068 1.3%
Balance Of State3 414,363 427,176 12,813 1.5%
1) Maricopa and Pinal Counties
2) Pima County 
3) All other areas in Arizona less Maricopa, Pinal, and Pima Counties 

Arizona’s industry employment projections are produced in conjunction with the U.S. Department of Labor (U.S. DOL), Employment and Training Administration (ETA).

Fletcher R. Wilcox is V.P. of Business Development and a Real Estate Analyst at Grand Canyon Title Agency.

He is author of www.TheWilcoxReport.com. His market analysis on residential real estate in Greater Phoenix has been mentioned in the Wall Street Journal, Bloomberg News, MarketWatch, HousingWire.com, National Mortgage News, Arizona Republic and the Phoenix Business Journal. He has been a guest speaker on local radio and both local and national TV.

He teaches real estate agents strategies on marketing and instructs real estate classes in residential contract writing and Arizona title procedures.  Fletcher started snowboarding in 2006. He is not very good.

Fletcher may be reached at mailto:FWilcox@GCTA.com  602.648.1230

Thanksgiving Celebration: Its History

thanksgiving2

Abraham Lincoln made the Thanksgiving Proclamation on October 3, 1863.  A purpose of the Proclamation was to unify the nation, which was in the midst of the Civil War.   Thanksgiving Day was to be the last Thursday of November.

abrahamlincolnCredit for the Thanksgiving holiday also goes to Sarah Josepha Hale, “the was the editor of Godey’s Lady’s Book, a popular magazine for women in 19th century America.” For years she campaigned for a Thanksgiving holiday and wrote a letter to President Lincoln encouraging it.

The Early History of Thanksgiving in America.

The earliest recorded history of  Thanksgiving in America is recorded in the book the History of Plymouth by William Bradford.  It was Bradford who declared “the celebration of Thanksgiving.”  Bradford was Plymouth’s second governor, a position he held for thirty years.  Bradford starts the story in 1606 when a group of people in Scrooby, England decided they had to escape the oppression of the Church of England and its regulations.  They moved to Holland.  Eventually the group left on the Mayflower and sailed to the New World seeking the freedom of religion.

The History of Plymouth tells of the challenges and hardships the people were willing to bear for individual liberty.  This group was called the Pilgrims.  Their story is riveting.  Upon arriving in the New World, while the Mayflower was docked and while William Bradford was on a scouting trip, his wife Dorothy fell off the Mayflower and drowned.  It has been questioned if it was an accident or when his wife saw the bleakness of the land gave up.  There are characters such as Massasoit, “the chief of the nearby Wampanoags, signed a treaty of alliance with the Pilgrims in the summer. In exchange for assistance with defense against the feared Narragansett tribe, Massasoit supplemented the food supply of the Pilgrims for the first few years.”

Let’s not forget Squanto.  Squanto lived in the Plymouth area and was kidnapped by the English and brought to England.  He lived in England for nine to ten years before coming back home.  He was then captured again and this time  taken to Spain where he was sold into slavery.  Catholic Fryers bought Squanto.  Squanto eventually made his way back home a few months before the Pilgrims arrived.  Squanto learned English and France.  Squanto became a friend of the Pilgrims and helped them survive the harsh New World.  Amongst other things, he taught the pilgrims how to fertilize the land with dead fish.

The first Thanksgiving celebration is said to have been in 1621.  Below is a writing from William Bradford in the English of his time.  Can you understand it.

Ye First Thanksgiving in Ye New World

By William Bradford

“I may not here omite how, notwithstanding all their great paines & industrie, and ye great hopes of a large cropp, the Lord seemed to blast, & take away the same, and to threaten further & more sore famine unto them, by a great drought which continued from ye 3 weeke in May, till about ye middle of July, without any raine, and with great heat (for ye most parte), insomuch as ye corne begane to wither away, though it was set with fishe, the moisture wherof helped it much.  Yet at length it begane to languish sore, and some ye drier grounds were partched like withered hay, part wherof was never recovered.  Upon which they sett aparte a solemne day of humiliation, to seek ye Lord by humble & fervente prayer, in this great distrese.  And He was pleased to give them a gracious and speedy answer, both to their owne, & the Indeans admiration, that lived amongst them.  For all ye morning, and greatest part of the day, it was cleare weather & very hotte, and not a cloud or any sign of raine to be seen, yet toward evening it began to overcast, and shortly after to raine, with shuch sweete and gentle showers, as gave them cause of rejoyceing, & blessing God.  It came without either wind or thunder, or any violence, and by degreese in yet abundance, as that ye earth was thorowly wete and soked therwith.  Which did so apparently revive and quicken ye decayed corne &  other fruits, as was wonderfull to see, and made ye Indeans astonished to behold; and afterwards The Lord sent them shuch weather as, through His blessing, caused a fruitfull rejoicing.  For which mercie (in time conveniente) they also set aparte a day of Thankgiving…”

I wish you a wonderful Thanksgiving Day.

Fletcher Wilcox 2016 picture

Fletcher R. Wilcox is V.P. of Business Development and a Real Estate Analyst at Grand Canyon Title Agency.

He is author of www.TheWilcoxReport.com. His market analysis on residential real estate in Greater Phoenix has been mentioned in the Wall Street Journal, Bloomberg News, MarketWatch, HousingWire.com, National Mortgage News, Arizona Republic and the Phoenix Business Journal. He has been a guest speaker on local radio and both local and national TV.

He teaches real estate agents strategies on marketing and instructs real estate classes in residential contract writing and Arizona title procedures.  Fletcher started snowboarding in 2006. He is not very good.

Fletcher may be reached at FWilcox@GCTA.com  602.648.1230


Earlier history of Thanksgiving in America.


What time of the year are there the most new listings and the most real estate sales? A review of the numbers in Greater Phoenix.

 When are Real Estate Agents the Busiest?

By

Fletcher R. Wilcox

Grand Canyon Title Agency

Real estate agents make their commissions as listing agents and as selling agents. So at what times of the year are agents the busiest listing seller’s homes and closing on sales with buyers? What times of the year are listings and sales the slowest? Does real estate activity really slow down in the hot summer months?

So, what I did was research the number of new listings and sales for existing single family homes in Maricopa County, Arizona.  I broke down the years 2014, 2015 and the first half of 2016 into quarters. The data is from the Arizona Multiple Listing Services, Inc. (ARMLS).

The Findings

image001

New Listings: Which Quarter Had the Most and the Least?

In both 2014, 2015 and in the first half of 2016 we saw the same pattern for new listings. The first quarter, the winter quarter, had the most new listings. Then like a stair step, the number of new listings declines in each of the following quarters with the fourth quarter having considerable less new listings than the first quarter. Then as the chart below shows, listings shoot up again in the first quarter of the New Year.

More New Listings and Sales in First-Half of 2016 Than in Either 2014 or 2015

When comparing the number of new listings in the first two quarters of 2016 there were 2,792 more new listings than 2015 and 1,280 than 2014. This increase in inventory along with job growth and population growth and boomerang buyers has fueled home ownership. There were 1,268 more sales in the first two quarters of 2016 than 2015 and a whopping 4,243 more sales than 2014.

image001


Sales

Sales: Which Quarter Had the Most and Least?

While the first quarter has the most new listings, the second quarter has the most sales. The chart below shows single family sales. In 2014, the quarter with the least number of sales was the first quarter. In 2015, it was a toss-up for the least number of sales between the first quarter and the fourth quarter. There were only thirty-six more closings in the fourth quarter over the first quarter. The second best quarter for sales has been the third quarter.

There are More Sales in the Hot Summer Months Than You Might Think

If we compare sales in the third quarter, the hot weather months of July, August and September, to the best quarter, the second quarter, we saw a decline in sales of 12% in both 2015 and 2014.

However, the third quarter has been the second best quarter for sales. In 2015, third quarter sales were 18% higher than in both the first and fourth quarters.

image002

Conclusions

In recent history, the first and second quarters of the year had the most new listings followed by the second and third quarters as the most sales. While real estate sales slow-down in the hot weather third quarter compared to the spring second quarter, the third quarter has been the number two quarter for most sales. While sales in the first and fourth quarters are the slowest, there is still lots of sales activity. Data shows sales in the first and fourth quarters range between 12,000 and 14,000. Look for sales in the fourth quarter of  2016 to be over 14,000 sales.

Fletcher Wilcox 2016 picture

Fletcher R. Wilcox is V.P. of Business Development and a Real Estate Analyst at Grand Canyon Title Agency.

He is author of www.TheWilcoxReport.com. His market analysis on residential real estate in Greater Phoenix has been mentioned in the Wall Street Journal, Bloomberg News, MarketWatch, HousingWire.com, National Mortgage News, Arizona Republic and the Phoenix Business Journal. He has been a guest speaker on local radio and both local and national TV.

He teaches real estate agents strategies in marketing and instructs real estate renewal classes in residential contract writing and Arizona title procedures.  Fletcher started snowboarding in 2006. He is not very good.

Fletcher may be reached at FWilcox@GCTA.com  602.648.1230