Phoenix real estate market is coming back, report says. Will Phoenix real estate in 2015 be a buyer or seller real estate market?

http://roselawgroupreporter.com/2015/01/phoenix-housing-market-coming-back-report-says/?utm_source=The+Dealmaker+by+Belfiore+and+Rose+Law+Group&utm_campaign=2f82789d80-1_28_15_Dealmaker&utm_medium=email&utm_term=0_6de1c69ebc-2f82789d80-32164057

Phoenix housing market is coming back, report says

Posted by   /  January 27, 2015  /  No Comments

Wilcox graph

By Philip Haldiman, Editor-in-Chief | The Dealmaker

The Phoenix housing market has moved into recovery mode, according to a new report on single-family home sales, mortgage lending and job growth trends.

Arizona real estate analyst Fletcher Wilcox, author of the report, told The Dealmaker that while there is still pain in the local housing market, it’s now bouncing back because distressed properties have declined greatly, preventing home values from sky-rocking downward.

Another important factor is job growth in metropolitan Phoenix, he said.

“While job growth is lower than it has been historically — around two percent compared to four percent — greater Phoenix has gained back about 70 percent of jobs that were lost,” Wilcox said. “For the housing market to grow there has to be jobs.”

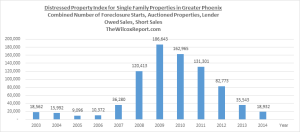
In greater Phoenix in 2009, 186,643 single-family properties either went into foreclosure, were auctioned, were sold as lender-owned properties or were short sales, Wilcox said.

Last year that number was 18,932, a 90 percent decrease.

The 2014 Distressed Property Index, which includes foreclosures, auctions, lender-owned properties and short sales, is now the lowest since 2006, Wilcox said.

“(Home values) have appreciated from the low point in August 2011,” he said. “Back then the median sale price for a single family property was $120,000.  In December 2014, the median sale price was $222,000.”

Highlights from 2014, Maricopa County

  • Foreclosure returned to 2005 levels.
  • Auctioned properties returned to 2003 levels.
  • Lowest lender-owned sales since 2007.
  • Lowest number of short sales since 2008.

(Source: ARMLS, compiled by Wilcox Report)  Posted by   /  January 27, 2015

Will 2015 be a buyers or sellers real estate market?  Stay tuned for the next report on the decrease in new listing inventory and the increase in mortgage purchases.

Fletcher Wilcox
Gilbert Real Estate: Is it a Buyer Or Seller Market? An interview with Amy Golba. Also December 2014 real estate results for Gilbert, Mesa and Chandler.

In this edition of TheWilcoxReport.com I discuss with Amy Golba the state of real estate market in the Southeast Valley of Greater Phoenix and specifically Gilbert, Arizona.  Amy is the owner and designated broker of Century 21 Platinum Real Estate.  Amy and her agents spend a lot of time in the Southeast Valley markets of Gilbert, Mesa, Chandler and Ahwatukee.  Amy is also a principal in the Golba Group, which manages over a thousand single family property rentals.    This interview was conducted in November 2014.

Year-to-Year Comparison of Existing Single Family Sales for the month of December

Below the video is a comparison of December 2014 to December 2013 existing single family homes sales for Gilbert, Mesa, and Chandler.  Median sale prices were up in all three cities this December over last December.  Gilbert shined with 23% more sales, while Chandler sales were about the same.  Mesa sales were up 6%. The data is from the Arizona Regional Multiple Listing Services, Inc.


Sales Sales Median Sale Price
City Month 2013 2014 Change Change 2013 2014 Change Change
Gilbert December 306 377 71 23.2% $254,375 $256,000 $1,625 0.6%
Mesa December 466 495 29 6.2% $187,000 $192,000 $5,000 2.7%
Chandler December 292 290 -2 -0.7% $245,000 $258,000 $13,000 5.3%

Phoenix Real Estate: Sales, Sales Volume, Mortgages up in October 2014. Distressed Properties Down

Below are charts and graphs from the October 2014 TheWilcoxReport.com

  • October 2014 existing sales slightly higher than October 2013.
  • October 2014 sales volume $42,095,372 higher than October 2013.
  • October 2014 Distressed Property Index at 1,483 compared to 14,889 in October 2009.
  • October 2014 new monthly listings were 1,016 less than October 2013.

In this report we compare performance for sales, sales volume, cash purchases, mortgage purchases, and new monthly listings. The comparisons are year-over-year, comparing a time period in 2014 to the same time period in 2013. Year-over-year comparisons are an effective way to measure performance, highlight differences, and negates the effect of seasonality.

Download (DOCX, 120KB)

Download (DOCX, 28KB)


Phoenix Real Estate: Were September 2014 sales results a market quip or trend?

The September Surprise

September 2014 was best month year-over-year for existing single family sales, sales volume, and mortgage purchases

September brought some good news for sales, sales volume, and mortgage purchases. The existing single family housing market gained a little momentum. The information in this report analyzes existing single family home sales in Phoenix. The use of the term Phoenix is a general term for those cities located in Maricopa County. The information was compiled from the Arizona Regional Multiple Listing Service, Inc. (ARMLS).

To see full report go to https://gcta.com/wp-content/uploads/2014/10/September2014ExisitingHomeSalesforPhoenix-.pdf

In this report we compare performance for sales, sales volume, cash purchases, mortgage purchases, total active listings, new monthly listings and estimated months of supply. Most of the comparisons are year-over-year, comparing a time period in 2014 to the same time period in 2013. Year-over-year comparisons are an effective way to measure performance, highlight differences, and negates the effect of seasonality.  Are you ready?

Download (DOCX, 23KB)

Sales of Existing Single Family Homes. September 2014, was the first month this year in which there were more sales compared to the same month of last year. Well, the number of sales was small. There were 20 more sales. While 20 may not be much, it is a lot better than May 2014, when there were 1,360 less sales than the previous May. See Table One, page six.

Sales Volume. Better than the slight increase in September sales was a much larger increase in sales volume. Home appreciation over the last year, and the slight increase in sales made September the first month this year that the total dollar volume of sales was higher than for the same month of the previous year. Total sales volume in September 2014 was up 4% or $48,000,000 more than September 2014. In May 2014, the 1,360 less sales resulted in $310,000,000 less in sales volume. See Table Two, page six. Total sales volume is determined by adding up the number sales and their sale prices. The average (mean) sales price in September 2014 was $274,019 or $9,316 higher than September 2013. The median sales price this September was $216,900 or $5,000 higher than last September.  See Table Three, page seven.

Cash Purchases and Mortgage Purchases. Purchases with cash continues to decline. They are down every month year-over-year. There were 968 in August and 959 in September. The last month that there were less than 1,000 monthly cash purchases was almost six years ago, in November 2008, when there were 894 cash purchases.

Less cash purchases should be no surprise. Investors make up the majority of cash purchases. Investors want to buy cheap. Most cheap sales are distressed sales. The number of distressed properties for sale is down considerable from the flood a few years ago. In the month of September 2010, 14,301 properties fit into one of these four distressed categories: foreclosure start, auctioned property, lender owned sale or short sale. In September 2014, only 1,535 or 12,766 less properties than September 2010 were in one of these four categories.

In the first quarter of 2014, sales were not only down because of less cash purchases, but also because there were less mortgage purchases. There were 2,207 less cash purchases, 354 less conventional loan purchases, 197 less FHA loan purchases, but 119 more VA loan purchases in the first quarter of 2014. See Table Seven, page ten.

Thus, the media reports of a flamed out Phoenix real estate recovery. But something changed. The mortgage purchase market gained vigor. September 2014, was the fourth consecutive month year-over-year there were more mortgage purchases. For the months June through September, there were 719 more FHA purchases, 303 more VA purchases, 56 more conventional loan purchases, while there were 2,807 less cash purchases. See Table Eight, page 10.

Conclusion and Prediction

When segmenting the single family market into cash versus mortgage purchases, it should be no surprise that cash purchases are decreasing and mortgage purchases increasing. As the residential market recovers, there will be less foreclosures and short sales available for cash investors to buy. And as the number of jobs, population and eligible boomerang buyers continues to increase, mortgage purchases should increase. While job growth and population growth are slower than hoped for, they are still positive. As to boomerang buyers, their numbers increase every day. Every day more of them have met the FHA three year wait period to buy again after a foreclosure or short sale.

So, were this September’s year-over-year increase in sales, total sales volume and mortgage purchases a quip or trend?

Table Seven year-over-year results for June through May shows that the number of conventional loans purchases about even, but FHA loan purchases up 16% and VA purchases up 4%. Early October 2014 numbers support sales at the same pace as October 2013. The numbers mirror September results in that they show a year-over-year decrease in cash purchases and an increase in mortgage purchases. The momentum of the mortgage purchase market should make the last quarter of 2014 the best quarter year-over-year in 2014 for home sales and total sales volume. Excluding of course some unforeseen economic event or other crisis.

I go with September 2014 results as part of a positive housing trend and not a quip or blip.

An interview with National Fox Business News Host Gerri Willis on Phoenix real estate.

Gerri Willis of the Willis Report In May 2014, said things may be cooling off in the Phoenix real estate market because cash deals were down. My response to this cooling off and less cash deals is because our market is normalizing. Normalizing in that the market is becoming more of a mortgage purchase market, and less of a cash purchase market because the foreclosure crisis is over.

https://www.youtube.com/watch?v=4WkUe7KhfGU

Phoenix Real Estate: Is it a buyer or seller market? Fletcher Wilcox interviews real estate agent Susan Ramsey


On today’s show I interview Susan Ramsey of Keller Williams. http://www.theramseyteam.com/

She answers the question, “Is it a buyer or seller market?”

Susan has sold and listed residential properties for twenty-three years. She spends much of her time working in Northwest Phoenix, Glendale, Peoria and Sun City.

In answering the question on whether it is a buyer or seller market Susan discusses prices points, property condition, staging, micro markets, how much is a home worth per square foot.

She says what sets her team apart is client care. Her team responds quickly. When she meets with a seller she reviews the property and the property’s competition. In her market analysis she gives the seller or buyer information to them to help them make a logical decision. She will tell a seller or buyer what they need to know not what they want to hear.

VA loans or mortgages grow in importance for Phoenix real estate market: Overall sales are down, but surging are sales with VA loans.

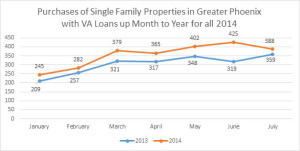
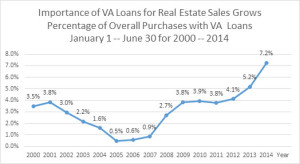
While the number of sales of single family existing homes in Greater Phoenix have been down every month this year compared to the same month of last year, not so when it comes to sales involving VA loans.  The number of sales in which a buyer financed the purchase with a VA loan or VA mortgage is up every month this year compared to the same month as last year.  See Chart One below.  In fact, VA loans were 7.2% of all sales of single family existing homes for the first half of 2014 in Greater Phoenix.  The percentage of 7.2% has not been higher this century.  In 2013 the percentage was 5.2% and was 4.1% in 2012.  See Chart Two.

The United States Department of Veteran Affairs, shows the veteran population in Arizona at 527,400 as of September 30, 2013.   A veteran may purchases a home with no down payment up to a $417,000 purchase price.  According to the Arizona Regional Multiple Listing Services, Inc. (ARMLS), for the first six months of 2014, there were 2,098 single family existing homes purchased with a VA loan.  Ninety-nine of these sales had purchase prices over $417,000.   The highest purchases price this year with a VA loan was in Scottsdale, Arizona.  The purchase price was $1,000,000.  I spoke with the selling agent Lyn Trayte with Dominic and Co. International Real Estate.  She said the buyer was a retired veteran and the transaction went smoothly.

Demand for VA loans up as other mortgages fall  an article by Catherine Reagor from the Arizona Republic.

If you need a referral for a lender who knows VA loans contact me at FWilcox@gcta.com or 602-648-1230                                                                                

Table One:  Number of Purchases with a VA Loan for Single Family Existing Properties in Greater PhoenixVA loans1


2013 2014 Difference
January 209 245 +36
February 257 282 +25
March 321 379 +58
April 317 365 +48
May 348 402 +54
June 319 425 +106
July 359 388 +29

Table Two:  Percentage of Overall Purchases with a VA Loan 

January 1 through June 30 for 2000 through 2014 

VA Loan Percent

Fletcher R. Wilcox

V.P. Business Development, Real Estate Analyst

Grand Canyon Title Agency, Inc.

FWilcox@gcta.com   602-648-1230

Paradise Valley Real Estate: Video makes Inman News featured story!

The Power of Video:  Video of Paradise Valley luxury home makes Inman News featured story and shows seller praising listing agent.

On August 15, 2014 Inman news included a video in their featured story 6 tips to get your clients to brag about you.  The seller of a luxury home in Paradise Valley, Arizona sings praises of her listing agent in the video.  Right before the luxury home closed, I contacted the listing agent to see if she and the seller would let me interview them.  They both said yes.   I thought there was a story to be told about the home.  The property sold for $6.8 million and was 16,000 square feet.  The listing agent Victoria Felice used a different video of the property to send to potential long distance buyers.  She credits this video for helping to get the attention of the buyer who turned out to be a local buyer.

The testimonial from the seller gives a powerful boost to the skills and credibility of the real estate agent.  But there is another side of the story not told in this video.  The video was first released about seventeen months ago.  So about a year and a half after the video was released, the video receives national attention in the Inman News story.  So remember, video has a long life.  And long life is especially good when a client is praising you.  Below is link to the video and the Inman News story.

INMAN NEWS, August 15, 2014

https://www.youtube.com/watch?v=MjqasY8WS1E

We’ve all heard it said that it’s easier to keep a happy client than to lose an unhappy one. The unfortunate truth is that unhappy people are more likely to spread their ill feelings about something or someone (whether justified or not). Here’s a few excellent ways to get your happy clients to spread the word about you.

Video testimonials — Video is an extremely valuable marketing tool in today’s high-tech world. Ask your clients if they would be willing to give you a video testimonial. Set a time with them and start recording. Put all your testimonials together in one video and post it to YouTube, your website and blog site, and social media. Victoria Felice did an awesome job of creating a testimonial video below. It certainly has the WOW effect!

To read the full article in Inman News by Pamela Cendejas of Second Self Virtual Assistance that was posted on ActiveRain.

http://www.inman.com/next/how-to-get-your-happy-clients-to-spread-the-word-about-you/?utm_source=20140815&utm_medium=email&utm_campaign=dailyheadlinesam

Have a great day!

Fletcher R. Wilcox

V.P. Business Development, Real Estate Analyst

Grand Canyon Title Agency, Phoenix, Arizona

FWilcox@gcta.com   602-648-1230

June 2014 Real Estate Sales, Listings, Mortgages and Job Growth Trends in Greater Phoenix

To view the full report with charts and graphs go to

http://issuu.com/iwantyourescrow/docs/june2014thewilcoxreport__/0

June 2014 Trends

  • June 2014 data shows increase in mortgage purchases. Page 2
  • No precedent on how homes are being purchased. Historic Review 2000 through 2014. Pages 4-6
  • More conventional loan purchases in June 2014 than June 2013, finally. Page 7
  • More purchases with FHA in second quarter 2014 than in 2013. Page 8
  • VA purchases surge. At highest numbers this century. Pages 8-9
  • Sales from 2000 through 2014. Page 13
  • June 2014 new monthly listings drop below last year’s level. Page 14
  • Breakdown by city for new monthly listings, sales, median sales price. Pages 17-26  

While Overall Sales are Down, Sales with a Mortgage Gain Momentum

Noticeable lower in the first half of 2014 compared to 2013 are the number of sales for existing single family properties in Greater Phoenix. Conspicuously lower are the 4,990 less sales purchased with cash. A majority of cash purchases are by investors. Cash purchases are down because purchase prices went up. Prices went up because distressed inventory went down, way down. The number of cash purchases under $100,000 were 937 in the first six of months of 2014, 3,672 for all of 2013, and 38,620 from 2010 through 2012. Cheap properties are gone. The market is becoming more stable. Home sales are more dependent on mortgages. Mortgages are dependent on job and wage growth.

Not as noticeable, as the decrease in sales, is the increase in the number of sales in which a buyer purchased by qualifying for a mortgage.

Comparing Mortgage Purchases in 2014 to 2013

Even though purchases with a mortgage increased every month in 2014, overall sales took a double hit in the first quarter of 2014 compared to 2013, in that cash purchases were not only down, but also mortgage purchases were down. Mortgage purchases this April and June gained a little momentum and were higher than for the same months in 2013.

When we break out mortgage purchases by conventional loan, FHA insured loan and VA guarantee loan, June 2014 was the first month this year that there were more conventional loan purchases, 98 more, compared to the same month in 2013. FHA purchases were 175 higherthis June than last June. This is most likely due to an increase in purchases by boomerang buyers. Boomerang buyers are those who went through a foreclosure or short sale. The reason many are using FHA financing to purchase is that after going through a foreclosure or short sale, FHA generally has a shorter wait period to obtain financing than does Fannie Mae or Freddie Mac. The FHA three year wait period after a foreclosure is shorter than the Fannie Mae and Freddie Mac seven year wait period. The FHA three year wait period after a short sale is shorter than the Freddie Mac four year wait period. Fannie Mae’s wait period after a short sale goes from a minimum two year period to a four year period on August 16, 2014. Sales with FHA loans will continue to rise as more boomerang buyers enter the home buying market and qualify with the shorter FHA wait period. I spoke with a loan officer who closed a transaction in which the buyer put a $100,000 down payment on a purchase with an FHA loan. This would have been unheard of before the great real estate recession. The buyer went with FHA because they could get a loan today, and not have to wait to qualify under the longer Fannie Mae and Freddie Mac guidelines. For more information on the increasing number ofboomerang buyers that may be eligible to buy with FHA in 2014 in Greater Phoenix go pages 11 and 12 in the following TheWilcoxReport.com   https://gcta.com/wp-content/uploads/2014/02/GreatPromiseforGreaterPhoenix-.pdf

The maximum FHA loan amount allowed in Maricopa County (Greater Phoenix) is $271,050. The required FHA down payment is three and one-half percent. So, if a buyer purchases with the maximum loan amount of $271,050 and puts down the required down payment of three and one-half percent or $9,830 in this case, the purchase price will be $280,880. Of course a buyer could purchase a property with FHA financing for more than $280,880 if they put down more than the minimum down payment of three and one-half percent.

Surging are sales with VA loans. In June 2014 there were 425 purchases with VA loans in Greater Phoenix. In reviewing ARMLS data, this is the highest number of VA purchases in a month this century, and the second month in a row with over 400 VA purchases. VA purchases of existing single family properties averaged 4.0% of sales from 2009 through 2012, then 5.7% in 2013, and 7.2% for the first half of 2014. A VA loan does not require a down payment for purchases up to $417,000. Some lenders will allow a VA loan on a purchase price up to $1,000,000. ARMLS data shows in June 2014 eight sales over $500,000 in which there was a VA mortgage. According to the United States of Department of Veteran Affairs, the veteran population in Arizona is 527,400 as of September 30, 2013 http://www.va.gov/vetdata/Veteran_Population.asp

The likely outcome for mortgage purchases in the second half of 2014 should be more FHA and VA loans than the second half of 2013. Purchases with conventional loans in 2014 will struggle to meet 2013 levels.

 No Recent Precedent on How Single Family Properties are being Purchased: A Review of 2000 through 2014

Reviewing the first half of 2014 as to how existing single family properties were purchased we find 26% by cash, 42% by conventional loan, 23% by FHA loan, 7% by VA loan and other at 1%. When going back fourteen years to find similar percentages there is no precedent. 2014 Cash purchases of 26% are lower than when they were in 2011, 2012 and 2013, but much higher than the years 2000 through 2008. Conventional loan purchases of 42% are the highest since 2008, but much lower than when they were 77% in 2007. FHA purchases of 23% are higher than in 2012 and 2013, lower than 2009, 2010, 2011, and higher than the years 2000 through 2008. VA purchases of 7% are the highest in fifteen years. To see purchases trends for the fifteen years go to pages 5 and 6.

New Monthly Listings in June 2014 Drop Below June 2013 Level

The number of new listings in June 2014 were 393 less than June 2013. This is the first time this year there were less new listings in a month compared to the same month of last year. See page 14. Overall, there are 63% more listings on the market today than last year at this time. Listings have increased in every price range except below $100,000 and over $10,000,000. See page 15. For a breakdown of new monthly listings for twenty cities in Greater Phoenix go to pages 17-26.

June 2014 New Monthly Listings Drop Below Last Year’s Level. Mortgage Purchases Increase in Greater Phoenix.

For the first time this year, new monthly listings of existing single family homes dropped below last year’s level.  The number of new listings of single family homes in June 2014 was 404 or 5.7% less than June 2013.  In the first few months of 2014, new monthly listings were up over ten percent per month compared to last year, then the number of new monthly listings started trending downward.

Table: New Monthly Listings of Single Family Homes in Greater Phoenix

2013 June  2014 June          Change       % Change      
January 7,034 7,977 943 13.4%
February 6,292 7,196 904 14.4%
March 7,114 7,835 721 10.1%
April 7,224 7,490 266 3.7%
May 7,343 7,401 58 0.8%
June 7,049 6,645 -404 -5.7%

How long will buyers have more inventory choices?  Even with the recent decline in new monthly listings, buyers still have more choices than last year.  Currently there are 16,840 active single family listings compared to 10,190 at this time last year.

Table: Mortgage Purchases Increase, Cash Purchases Decrease for Existing Single Family Sales in Greater Phoenix

2013 June 2014 June Change % Change
Cash Purchases 2,046 1,145 -901 -44.0%
Mortgage Purchases 3,976  4,340 364  9.10%
Total Sales / Purchases 6022 5,485 537 -8.90%

A more comprehensive report for June 2014 sales in Greater Phoenix will be out soon.

Fletcher Wilcox Real Estate Analyst at Grand Canyon Title Agency, Inc. Fwilcox@gcta.com   602-648-1230

Putting into Context the Greater Phoenix Housing Market: Looking at the Numbers

To read full report go to     http://gcta.com/v2/wp-content/uploads/2014/06/April2014-HousingReport-.pdf

The WilcoxReport.Com Insight on Single Family Housing, Lending and Job Growth Trends 

By

Fletcher R. Wilcox

V.P. Business Development, Real Estate Analyst at Grand Canyon Title Agency, Inc.

FWilcox@gcta.com  602-648-1230

   April 2014 Report on Existing Single Family Home Sales for Greater Phoenix

  • Cooled Down: Sales under $200,000, Except for FHA Purchases
  • Cooled Down: Cash Sales
  • Cooled Down: Distressed Sales
  • Warming Up: Mortgage Purchases with FHA Insured Loans and VA Guaranteed Loans
  • Warming Up: First Time Homebuyers and Boomerang Buyers
  • Hot: Luxury Sales
  • Cooling Down: Number of New Monthly Listings

Conclusion

The single family housing market in Greater Phoenix has transitioned from a dominant cash purchase market fueled by inexpensive lender owned sales and short sales into a housing market more dependent on purchases with a mortgage.

When it comes to picking a mortgage, if a potential buyer has a choice between choosing either a conventional loan or an FHA loan, most will go conventional over FHA for the following reasons: The buyer has more money. They have at least the minimum required down payment of five percent which is higher than the FHA minimum required down payment of three and one-half percent. A higher down payment means a lower loan and lower mortgage payment for the borrower; Mortgage insurance is another reason. A borrower has to pay monthly mortgage insurance on a conventional loan if their down payment is less than twenty percent. With an FHA loan, a borrower not only pays monthly mortgage insurance, but there is an additional mortgage insurance premium added to the principle balance of the loan. If during the life of a conventional loan the borrower’s equity reaches eighty percent, the monthly mortgage insurance may be removed by the lender. This is not so with an FHA loan. FHA monthly mortgage insurance stays for the life of the loan.

If a potential buyer cannot qualify for a conventional loan, they might qualify for an FHA loan for the following reasons: As mentioned above, FHA has a lower down payment requirement; A borrower may qualify for FHA with a lower credit score than with conventional; Finally, someone who went through a foreclosure has to only wait three years to buy again with FHA, while most conventional loans require a seven year wait period.

The research in this report showed an increase in FHA purchases in April 2014 over April 2013. I believe this data suggests the emergence of an increasing first time homebuyer and boomerang buyer market who are able to qualify with FHA, but not with a conventional loan. I also believe that purchases with FHA loans will likely increase because of population growth and the high number of people who went through a foreclosure and want to own again.

Purchases with VA loans continue to be an important segment of the mortgage market. In 2012, VA loans were 4.4% of the existing single family purchase market. In 2013 VA loans were 5.7% of the purchase market, and year to date in 2014, 7.2% of all purchases. If a veteran went through a short sale or foreclosure a VA loan only requires a two year wait period.

Overall, the Greater Phoenix housing market will continue to improve. The speed at which the mortgage purchase market will grow and fuel the housing market depends much on job growth. Greater Phoenix has a mediocre 2.2% job growth number. If job growth once again reaches and sustains a growth rate of 4% to 5% the housing market would flourish.