Arizona REALTOR® Voice: https://blog.aaronline.com/2015/08/cfpb-pilots-eclosings-with-consumers/

CFPB Pilots eClosings with Consumers and Don’t miss this Years Industry Partners Conference on September 16!

by Arizona REALTORS on August 14, 2015

American Banker recently shared news that the Consumer Financial Protection Bureau (CFPB) has ramped up its push for the mortgage industry to switch to an electronic closing process after results from a pilot program.

The CFPB’s four-month pilot study showed that consumers who used eClosings had a 7 percent higher rate of positive feedback about their understanding of the quotes and final costs of the loan.

“eClosings are the future of mortgage industry,” said Fletcher Wilcox, VP Business Development, Grand Canyon Title Agency in Phoenix.

“I downloaded the ninety page study,” Wilcox continued, “and one of the findings said ‘early document delivery and review was associated with better measured outcomes in both paper and eClosing transactions, but the early delivery of documents occurred much more consistently in the eClosings.’

“The new October 3 [TRID] rule, in which the buyer has to have the Closing Disclosure three business days before signing, is already moving in the direction of the borrower having information earlier,” he added.

REALTOR® Magazine reported that consumers felt “less rushed” with the eClosing process and it was “more efficient” than reading and signing in-person at the closing table.

“Legal, regulatory and fraud factors will also have to be considered when moving toward eClosings,” cautioned Wilcox, “but it is a process that will happen over time.”

Wilcox also chairs the 2015 Industry Partners Conference on September 16. Click here to register for this event.

Fletcher R. Wilcox

V.P. Business Development, Real Estate Analyst, CFPB External Operations Expert

Grand Canyon Title Agency

FWilcox@gcta.com  602.648.


(IPC) Industry Partners Conference – Wednesday, September 16th, 2015

Date: Wednesday, September 16th, 2015
Time: 8:00am – 4:15pm
C.E. Credits: 3 Contract Law / 3 Legal Issues
Cost: 79.00
Type: AAR Events
Registration: Register Here
Description: REALTORS®…MORTGAGE LENDERS…ESCROW AGENTS…ALL WORKING TOGETHER TO MAKE IT HAPPEN! You will not want to miss this years event! Join in the conversations about the CFPB and the new closing process. How the new TRID rules changed the closing of a residential real estate transaction. Review new changes to the AAR Residential Purchase Contract, Pre-Qualification form, the LSU…. Don’t hesitate, register TODAY!
Flyer: View Flyer
Calendar: Download this event for Outlook or iCal
Location: Chaparral Suites
Address: 5001 N Scottsdale Road, Scottsdale, AZ 85250

https://thewilcoxreport.com/1337/

Almost 1,000 more sales this June in Greater Phoenix – and not because of cash buyers

July 28, 2015

www.TheWilcoxReport.com

Insight on existing single family sales, mortgage and job growth trends in Greater Phoenix or Maricopa County.

June 2015 Existing Single Family Sales Trends

  • June 2015 existing single family sales over 6,000 for third consecutive month.
  • June 2015 median sale price of $240,000, highest since January 2008, but still has a way to go to reach historic mark of $287,500 in June 2006.
  • June 2015 sales volume $411,049,735 higher than June 2014.
  • June 2015 sales volume highest for a month of June since 2006.
  • Snap shot of last twelve years of the month of June for foreclosure starts, auctioned properties, lender owned sales, and short sales.
  • Zillow’s Typical Error in Greater Phoenix is $13,650.

 By

Fletcher R. Wilcox

CFPB External Operations Expert

V.P. Business Development, Real Estate Analyst

Grand Canyon Title Agency

 New-GCTA-Logo

GCTA is a wholly owned subsidiary of FNF. FNF is ranked #314 on the list of Fortune 500 companies

The June Story   Loans

June 2015 existing single family home sales almost a 1,000 more – but not because of cash buyers

Sales of existing single family homes increased notably in June 2015. There were 980 or 18 percent more sales this June than last June. Driving the increase in sales were buyers purchasing with a home loan or mortgage.

How Purchased 2014 June 2015 June Change %  Change
Cash            1,138            1,181 43 4%
Mortgage            4,317            5,254 937 22%
Total            5,455      6,435 980 18%

When segmenting June 2015 mortgage purchases into the categories conventional mortgages, FHA mortgages and VA mortgages, conventional mortgages led the way with the most purchases. There were 2,946 purchases with conventional, 1,790 with FHA and 438 with VA. When comparing year-over-year percentage increases, FHA purchases had the highest percentage increase at 32%, conventional loans were 18% higher, and VA loans 13% higher.

How Purchased 2014 June 2015 June Change % Change
Cash            1,138            1,181    43  4%
Conventional            2,491            2,946    455  18%
FHA            1,352            1,790    438  32%
VA              426              480     54  13%
Other                48                38    10  21%
Total            5,455            6,435    980  18%

FHA Mortgage Purchases: Some reasons for the year-over-year percentage boost in FHA purchases are the following:

  • On January 26, 2015 the FHA mortgage insurance premium was lowered by .50 basis points or ½ percent. Thus, allowing more people to qualify.
  • The required FHA down payment is low at three and one-half percent (3.5%).
  • For buyers that went through a foreclosure or short sale, FHA has a shorter time period or penalty box period to buy again than does Fannie Mae or Freddie Mac. A buyer only has to wait three years, after a foreclosure or short sale to buy again under FHA underwriting guidelines. Under Fannie Mae and Freddie Mac underwriting guidelines a buyer has to wait seven years after a foreclosure and four years after a short sale.

VA Purchases: While the number of buyers purchasing with a VA loan is considerable lower than FHA or conventional loans, VA purchases have had the highest percentage gains since the great real estate recession. VA loan purchases in June 2015 were 7.4 percent of all purchases. In June 2013 they were 5.3%, in June 2011 4.1%, in June 2009 3.7%, and in June 2007 1.2%.

According to the U.S. Census Bureau Arizona has 522,387 retired or active veterans. http://quickfacts.census.gov/qfd/states/04000.html

The growing mortgage purchase market: A year-over-year comparison for first half of 2015

Since February 2015 mortgage purchases have taken off. There were 3,729 more mortgage purchases the first six month of 2015 compared to the first six months of 2014.

2014 2015
Jan          2,482          2,488
Feb          2,786          3,165
March          3,558          4,475
April          4,106          4,831
May          4,206          4,991
June          4,317          5,234
Total        21,455        25,184

Growth

What is fueling the growth in purchases with a mortgage?   

More jobs and more people and more boomerang buyers lift sales.

Jobs

 Job growth: You have to have a job to get a loan or mortgage. Greater Phoenix has gained back 250,000 non-farm jobs after losing 300,000 of them.


Download (PDF, Unknown)

Population growth: Maricopa County was the number two county in the nation in actual population increase with 74,000 more people according to the US Census Bureau. As of July 1, 2014 the population estimate of Maricopa County was 4,087,191.

http://factfinder.census.gov/faces/tableservices/jsf/pages/productview.xhtml?src=bkmk

*Population increase

  1. Harris, Texas (Houston) 89,000
  2. Maricopa, Ariz. (Phoenix) 74,000
  3. Los Angeles, Calif. 63,000
  4. San Diego, Calif. 41,000
  5. Clark, Nev. (Las Vegas) 40,000
  6. Bexar, Texas (San Antonio) 34,000
  7. King, Wash. (Seattle) 33,000
  8. Dallas, Texas 33,000
  9. Riverside, Calif. 32,000
  10. Tarrant, Texas (Fort Worth) 31,000

*Source: Phoenix Business Journal http://www.bizjournals.com/phoenix/news/2015/03/26/census-maricopa-county-2nd-in-population-growth.html

 Ready to buy

Boomerang Buyers: Boomerang buyers are defined as those people who went through a foreclosure or short sale and want to own again. I estimate that by the end of 2015, it will have been at least three years for 137,000 past homeowners that either went through a foreclosure or short sale. Some of these people will have already bought a home. Some will be ready to own again, purchasing with an FHA loan because of the shorter penalty box time period of three years after a foreclosure or short sale. These future buyers will still need to meet the necessary FHA underwriting requirements for length of employment, down payment and credit score.  

Download (PDF, Unknown)

Sales

Existing single family sales in June 2015 was the third consecutive month existing single family sales were over 6,000. June 2015 sales of 6,435 were the highest since May 2013. In 2014 there were not any months with over 6,000 sales.

New Price

The median sale price was $217,500 in January and ended up at $240,000 in June.

Download (DOCX, 13KB)

Download (PDF, Unknown)

June 2015 sales volume highest for a month of June since 2006.

Download (DOCX, 133KB)

Summary

The increase in sales of existing single family home is a flowing together of more mortgage purchases due to more people with more jobs, along with more boomerang buyers and more veterans. The best indicator that the existing single market is coming back is the increase in sales volume of $411,049,735 this June over last June. This increase is the direct result of demand to own with a tight supply. This has pushed sales prices higher. Higher sales prices mean that there are less homes underwater and increased household equity, but higher sales prices makes affordability harder for those entering the market for the first time and for some boomerang buyers. I expect July 2015 existing single family home sales to be higher than July 2014. Below is an estimate for July sales.

  2014 2015 Change % Change
January 3,527 3,400 127 3.6%
February 3,917 4,185 268 7.0%
March 4,854 5,718 864 18.0%
April 5,591 6,098 507 9.1%
May 5,531 6,083 552 10.0%
June 5,455 6,435 980 18.0%
July 5,143 *5800 *657 *13.0%

*estimate for July 2015

Note: This report covers existing single family home sales in Greater Phoenix. The term Greater Phoenix refers to the geographic area of Maricopa County. The data in this report, unless otherwise mentioned, is compiled from the Arizona Regional Multiple Listing Services, Inc., also known as ARMLS.

In this report we compare performance for sales, sales volume, cash purchases, mortgage purchases, and new monthly listings.     The report includes foreclosure starts, auctioned properties, lender owned sales and short sales for the last twelve years for the month of June. Many of the comparisons are year-over-year, comparing a time period in 2014 to the same time period in 2015.  Year-over-year comparisons are an effective way to measure performance, highlight differences, and negates the effect of seasonality.


Zillow’s Typical Error in Metro Phoenix is $13,650

Posted on July 17, 2015 by John Wake

http://www.arizonarealestatenotebook.com/zillows-typical-error-in-phoenix-is-12896/?inf_contact_key=cfc6b4a7a8a66742935a2ac93ece694ed45a306dbfbf39782f3bb3c1c04d542a

The typical Zillow Zestimate error for metro Phoenix is $13,650.

Real estate agents hate Zillow’s estimates of home values, called Zestimates, because many are very inaccurate but mainly because many home buyers and homes sellers will fall in love with their inaccurate Zestimates. Home sellers fall in love with high Zestimates and home buyers fall in love with low Zestimates and it adds unnecessary drama to the home buying and selling process.

Here’s how it plays out, the Zestimate on a seller’s home is WAY too high but wishful thinking kicks in and the home seller really likes that high estimate and thinks up a bunch of reasons why it might be right. An economist would say that the homeowner “anchored” on the high Zestimate price.

 We real estate agents can try to show homeowners why the Zestimates for their homes are way off but they won’t usually buy it. They think we’re just trying to get them to price their houses below fair market value so they’ll be fast and easy sales for us greedy real estate agents.

This never happens to home sellers when their Zestimate is low. Home sellers immediately dismiss low Zestimates as being inaccurate but they fall in love with high Zestimates. Home buyers, on the other hand, might fall in love with that low Zestimate the home seller immediately dismissed.

 Zestimate Error Rate for Phoenix

Zillow is very good, however, about publishing the error rate of their Zestimates. I think it’s partly a CYA move but in metro Phoenix, the median error for Zestimates is 6.5%. They calculate the error by looking at actual sale prices of homes compared to their Zestimates immediately before the sale.

 In addition, Zillow says the median sale price in metro Phoenix is $210,000.

Apply 6.5% to $210,000 and we find that Zillow Zestimates in metro Phoenix are typically off by $13,650 but you don’t know if it’s $13,650 too high or $13,650 too low. And it’s worse than that because HALF of Zillow Zestimates are off by MORE than $13,650, sometimes a LOT more than $13,650.

 What’s the Typical Zillow Error for My Home?

You can fine tune the typical Zestimate error by putting your home’s price range into the equation. If your home is around $300,000, for example, just multiple $300,000 by 6.5% to get the typical error for Zillow Zestimates in that price range in metro Phoenix.

Zillow is very clear that Zestimates are not appraisals. In fact, Zillow says that for a home in the $300,000 price range in Metro Phoenix, their typical error is $19,500, but you don’t know if it’s $19,500 too high or $19,500 too low. And it’s worse than that because HALF of Zillow Zestimates are off by MORE than $19,500, sometimes a LOT more than $19,500.

 I’m going to publish a LONG article on Zillow Zestimate errors on my national blog next week but the takeaway is the paragraph above.

Disclaimer

While deemed accurate this report does not guarantee the accuracy of the data. Some numbers will change. Report may not reflect all real estate activity. Information should be verified. This article is of a general nature, and is not intended as investment advice, real estate advice, lending advice or legal advice. Please consult your broker, your lender, your own independent legal counsel, your certified public accountant. The information in this report may not be the opinion of Grand Canyon Title Agency.

Note: Included in some of the charts of this report may be a small number of new home sales.

TheWilcoxReport.com™

By

Fletcher R. Wilcox

Fletcher is a member or past member of the following associations

Arizona Association of Realtors www.aaronline.com

Arizona State Escrow Association http://www.azsea.org

Arizona Mortgage Lenders Association www.azmortgagelenders.com

Scottsdale Area Association of Realtors www.saaronline.com

Statistician for the Heart of Scottsdale Real Estate Tour http://www.saaronline.com/marketing/scottsdale.php

Homebuilders Association of Central Arizona www.hbaca.org

Scottsdale Chapter Women’s Council of REALTORS www.scottsdalewcr.com  

Fletcher is author of TheWilcoxReport.com This report provides statistics and analysis on single family real estate trends in Greater Phoenix. He is a contributing columnist for the Arizona Journal of Real Estate & Business and has written for Arizona Realtor Magazine a publication by the Arizona Association of Realtors. He has been a guest speaker on KTAR, KJZZ/NPR, KFNN, channel 3, 10, 12, channel 8’s Horizon show, Square Off Arizona and the Willis Report on Fox Business News. His residential analysis has been mentioned in the Wall Street Journal, Arizona Republic, AZCentral.com, Phoenix Business Journal, East Valley Tribune, Bloomberg News, Dow Jones MarketWatch, HousingWire.com and National Mortgage News.

He teaches renewal courses on the Residential Resale Real Estate Purchase Contract. Fletcher joined Alice Cooper’s Solid Rock organization as a board member. The organization promotes music and the arts and has opened a center for teenagers in Phoenix   http://www.alicecoopersolidrock.com/the-rock/ Fletcher served eleven years as a citizen board member on the Phoenix Police Department’s Disciplinary Review & Use of Force Boards. He attends Living Streams Christian Church. Fletcher started snowboarding in 2008. He is not very good.


The CFPB: What really happens August 1, 2015 to closing a residential real estate transaction when there is a loan?

What really happens on August 1, 2015?

June 10, 2015 Scottsdale Area Association of REALTORS

By: Fletcher Wilcox, CFPB External Operations Expert, Grand Canyon Title Agency

Infographic showing a summary of CFPB 2015 changes coming August 1

Saturday, August 1, 2015 will seem just like any other hot summer day in Scottsdale.  But starting on August 1, any loan application completed that day or thereafter, will be under the new CFPB rules.  These new rules create new documents and change the residential closing process.

Even though the new rules are effective August 1, we will not know many of their effects on the closing process until September, because most contracts written in August involving a loan will not close until sometime in September.  But until then, there are many things real estate agents can learn about the new rules that will help them in preparing for the new closing process.

What percentage of residential closings will be effected by the new rules?  If the new rules had been in effect in May 2015, 76% or 5,627 of the 7,398 ARMLS residential closings in Maricopa County would have been affected.  76% is the number of closings in which a buyer purchased a property with either a conventional, FHA, VA or FMHA loan.  All these loan types fall under the August 1 rules.  Two loan types that are not included under the new rules are reverse mortgages, and home equity lines of credit also known as HELOCS.  The new rules do not apply to a cash transaction.

So what are the new documents and how is the closing process changed? 

The Good Faith Estimate and the initial Truth in Lending will be replaced by the Loan Estimate.  The HUD-1 Settlement Statement and final Truth in Lending will be replaced by the Closing Disclosure.

The emphasis of this article is the effect of the Closing Disclosure.  The Closing Disclosure has a timeline associated with it.  Before the borrower can sign loan documents, they must have the Closing Disclosure three business days in order to review it.  These three days are called the Waiting Period.

Let’s do a scenario.  According to line 73 of the Arizona Association of REALTORS® (AAR) Residential Resale Real Estate Purchase Contract the borrower is to sign loan documents three (full) days before the close of escrow date.  So if the close of escrow is a Friday, the borrower is to sign loan documents on the preceding Monday.  If the borrower is to have the Closing Disclosure three business days before signing the loan documents, the Closing Disclosure is to be delivered no later than the preceding Thursday.  So in this scenario the Closing Disclosure has to be received eight days before the close of escrow date.

Thursday Friday Saturday Sunday Monday Tuesday Wednesday Thursday Friday
Closing Disclosure received.Day one of waiting period. Day two of waiting period. Day three of waiting period. Sign loan documents COE

Before the Waiting Period begins, there are specific rules in how the Closing Disclosure may be delivered.  Depending on the delivery method (email, regular mail, hand delivered), additional days may be added to the above timeline before the Waiting Period begins.  Lenders are responsible for both the preparation and delivery of the Closing Disclosure to the buyer.  Currently the HUD-1 Settlement Statement is prepared and presented by the escrow company.  This process ends for loan applications taken on or after August 1, 2015.

What are others saying how the Closing Disclosure and its timeline may affect the closing process?   

Below are two links to videos produced by the National Association of REALTORS®.  I suggest you watch both for knowledge and understanding.

In the first video, it is suggested to add fifteen days to the closing time.  If you usually write a thirty day close of escrow when the buyer is purchasing with a loan you may want to extend that to a forty five day close of escrow.  Also suggested is that you make sure your clients are ready seven days prior to closing, and make sure that sellers abide by their agreements.  I believe these are suggested because you don’t want last minute changes or negotiations that may kick in a new Closing Disclosure – with a new three day waiting period – thus delaying the closing.  Note:  A new Closing Disclosure doesn’t automatically mean there will be a new Waiting Period.  An additional three day waiting period is required if the APR changes by 1/8% for a fixed rate mortgage.  So if your clients do something toward the end of the transaction that changes the APR there may be an additional three days before closing.  Adding a prepayment penalty or a change in the loan type also adds an additional three days.

http://www.realtor.org/videos/hud-1-going-away-understand-new-closing-forms-procedures

The second video mentions the need to educate your clients that transactions will likely take longer if the buyer is purchasing with a mortgage, and has other takeaways for real estate agents.

http://www.realtor.org/topics/trid-tila-respa-integrated-disclosure

It is my opinion that once we see the effects of the new rules, some agents will add contract language to the contract to address the new process and to protect their clients.  It is also my opinion that the process will be much smoother for those real estate agents, lenders and escrow companies that spend the time, now, learning the changes.

Fletcher R. Wilcox recently had added to his job description the title CFPB External Operations Expert at Grand Canyon Title Agency.  He is meeting with lenders and real estate agents and discussing how the closing process may be improved amongst them and escrow when the new rules take effect.  Grand Canyon Title is a wholly owned subsidiary of the Fortune 316 Company FNF.  All the local FNF brands in Arizona are working together in unity in presenting how they will be ready and prepared for August 1, 2015.

Fletcher is the author of www.TheWilcoxReport.comHis market analysis on residential real estate in Greater Phoenix has been mentioned in the Wall Street Journal, Bloomberg News, HousingWire.com and National Mortgage News.  He has been a guest speaker on both local and national TV and radio.  

– See more at: http://www.saaronline.com/news/2015/06/10/what-really-happens-on-august-1-2015#sthash.LbCWIGx4.dpuf

June 12 class on what you must know about new changes to the residential closing process. Class at Scottsdale Area Association of REALTORS.

What percentage of residential closings will be effected by the new rules? If the new rules had been in effect in May 2015, 76% or 5,627 of the 7,398 ARMLS residential closings in Maricopa County. Seventy-six percent is the number of closings in which a buyer purchased a property with either a conventional, FHA, VA or FMHA loan. All these loan types fall under the August 1 rules. Two loan types that are not included under the new rules are reverse mortgages, and home equity lines of credit also known as HELOCS.

Go to link below to sign up.

http://saaronline.com/cfpb-the-new-loan-estimate-and-closing-disclosure-forms-0

Some of the topics we will discuss are what your buyers and sellers should know about the new closing process.  How the new closing process will influence contract writing.  We will use scenarios.  We will discuss why did a representative from the National Association of REALTORS say that real estate agents may want to add fifteen days to the close of escrow.  What your sellers and buyers needs to know about the title insurance, the Closing Disclosure and AAR Residential Resale Real Estate Purchase Contract.  Did you know a new contract is coming out this summer.  What might change?      

  Some terminology you will need to know

  • The Closing Disclosure
  • The Delivery Period
  • The Waiting Period
  • Business days versus calendar days
  • Consummation
  • Why the amount of the owner’s title insurance policy and the lender’s title insurance policy shown on the Closing Disclosure may be different than what the buyer and seller actually pay

Fletcher R. Wilcox

CFPB External Operations Expert

V.P. Business Development and author of www.TheWilcoxReport.com

Grand Canyon Title Agency is a wholly owned subsidiary of Fidelity National Financial (FNF).  FNF is ranked number 316 on the list of Fortune 500 companies.

Know important changes August 1, 2015 to the residential real estate closing process. Learn them and earn three hours of contract law renewal hours.

I want to invite you to a class I am teaching on the changes to the real estate closing process that will take effect in about two months, this August 1, 2015.  These changes will affect your buyers and sellers.  This class is approved by the Arizona Department of Real Estate for three hours of contract law.

Some of the topics we will discuss are what your buyers and sellers should know about the new closing process.  How the new closing process will influence contract writing.  We will use scenarios.  We will discuss why did a representative from the National Association of REALTORS say that real estate agents may want to add fifteen days to the close of escrow.  What your sellers and buyers needs to know about the title insurance, the Closing Disclosure and AAR Residential Resale Real Estate Purchase Contract.  Did you know a new contract is coming out this summer.  What might change?      

This Friday, May 29, from 9:00 a.m. to 12:00p.m. the Scottsdale Area Association of REALTORs (SAAR) is hosting the class  CFPB – The “NEW” Loan Estimate & Closing Disclosure Forms.  The class will be held at SAARs new state of the art facility located at 8600 East Anderson Dr., Suite 200, Scottsdale, AZ 85255 • Phone (480) 945-2651  Click the link below to sign up.

  Some terminology you will need to know

  • The Closing Disclosure
  • The Delivery Period
  • The Waiting Period
  • Business days versus calendar days
  • Consummation
  • Why the amount of the owner’s title insurance policy and the lender’s title insurance policy shown on the Closing Disclosure may be different than what the buyer and seller actually pay

Click the link below to sign up.  The cost is twenty dollars.

https://netforum.avectra.com/eWeb/DynamicPage.aspx?Site=SAAR&WebCode=EventDetail&evt_key=ea3ca63c-2b57-43db-96b2-6eaeb238e988

And there will be a short review of residential sales trends, such as how the number of single family homes being purchased with conventional loans, FHA loans, and VA loans are increasing.  I will answer why they are increasing.

I hope to see you next Friday.

Fletcher R. Wilcox

CFPB External Operations Expert

V.P. Business Development

Real Estate Analyst

Grand Canyon Title Agency

Grand Canyon Title Agency is a wholly owned subsidiary of Fidelity National Financial (FNF).  FNF is ranked number 316 on the list of Fortune 500 companies.


Phoenix Real Estate: signs and numbers point to a hot spring housing market in Phoenix

February 2015 Results

Signs and numbers point to a heated housing market in Phoenix this spring

Purchases with a mortgage are increasing – decreasing are new monthly listings

February 2015 purchases with a mortgage were the highest for a month of February since February 2006

5,945 less new monthly listings for the last nine months year-to-year

  Changes coming to residential real estate closing process starting on August 1, 2015.  See page seven.

Download (PDF, Unknown)

Sales in which a buyer purchased with a mortgage in February 2015 were 15% higher than February 2014. February 2015 purchases with a mortgage were the highest for a month of February since 2006, which was before the great real estate recession. Is the February 2015 increase in mortgage purchases a sign that demand to own is growing? Maybe. There are some other recent signs. Mike Orr Director of the Center for Real Estate Theory and Practice at the W. P. Carey School of Business at Arizona State University said that “During February it became clear that from watching contract rates that the market was starting to take off.” Philip Haldiman from the Rose Law Group Reporter wrote that people are camping out to buy homes at a Mesa subdivision. The subdivision is the new Mulberry Community, by builder Blandford Homes. Purchase prices start in the low $200,000 and range from 1,700 to 4,300-square feet.  Watch this video from Catherine Reagor Arizona Republic reporter on once again camping out for new homes.

More signs and numbers pointing to an increase in purchases with a mortgage Increasing are job growth, and population growth, and boomerang buyers. While job growth and population growth are lower than their historic norm, and could be better, both are growing. At the same time job and population numbers grow, growing is the number of possible boomerang buyers. These three factors should contribute to an increase in mortgage purchases.

Increasing job growth. You have to have a job to get a loan. Greater Phoenix lost 302,100 non-farm jobs from December 2007 to July 2010 (December 2007 is the record month for most non-farm jobs, while July 2010 was the month with the least non-farm jobs since the start of the great real estate recession). Greater Phoenix has gained back 266,500 jobs from July 2010 to December 2014. From December 2014 to December 2015, jobs should grow by another 50,000.

Increasing population growth. The population grew by approximately 46,000 in 2014 over 2013. 2015 population growth is projected to increase by 57,000 over 2014. And from 2015 through 2020 projections are 327,800 more people. More people means more housing.

Increasing Boomerang Buyers: A boomerang buyer is defined as someone who buys after going through a foreclosure or short sale. As time goes on, more and more people will have reached the minimum wait periods or penalty boxes for being able to buy again with an FHA, Fannie Mae or Freddie Mac loan. I estimate that from 2009 through 2014, 220,536 homeowners that were owner occupants, not investors, either went through a foreclosure or short sale. The minimum wait period to buy again after a foreclosure or short sale is three years with an FHA insured loan; four years after a short sale with a Fannie Mae or Freddie Mac loan; and seven years after a foreclosure to purchase with a Fannie Mae or Freddie Mac loan. As time goes on, more and more people will meet the required wait periods, and if they have the necessary credit score, down payment, and closing costs they will be able to purchase with a mortgage. Let’s hope there will be enough inventory for them.

New Monthly Inventory of Single Family Homes June of 2014 was the first month last year, to have less new monthly listings when compared to the same month of the previous year. February 2015 was the ninth consecutive month year-to-year, that there were less new monthly listings, resulting in 5,945 less listings.

Sales by sold price range, median sale price, total volume The sold price range with the largest increase in sales year-to-year was between $200,000 and $249,999 with 185 more sales. The sold price range with highest year-to-year increase in percentage was between $300,000 and $349,999 with a 34% increase. There were thirteen more sales over $1,000,000 for an 18% increase. The February 2015 median sale price was $220,000 or $10,000 higher than February 2014. Total sales volume was $101,569,653 higher.

On August 1, 2015 new rules apply to most closed-end consumer mortgages. The rules effect existing and new home purchases, refinances, loans secured by vacant land, construction only loans, and timeshare loans. Excluded are reverse mortgages, home equity lines of credit, mortgages secured by a mobile home or a dwelling that is not attached to real property. The Consumer Financial Protection Bureau or the CFPB a creation of the Dodd-Frank Act, has integrated mortgage disclosures and created new forms. For loans originated on August 1, 2015 or later, the Good Faith Estimate and the Truth in Lending will be replaced with a new document called the Loan Estimate. And the final Truth in Lending and Settlement Statement are replaced with a new document called the Closing Disclosure. The new Loan Estimate and Closing Disclosure will make it easier for a buyer to compare their initial loan costs to their final loan costs. The timing of workflow and closings will be impacted by the new rules. The Closing Disclosure has new time tables associated with it. There is a Delivery Period and a Waiting Period before the borrower is allowed to sign loan documents. Ken Trepeta of Government Affairs for the National Association of REALTORS suggests adding fifteen more days to the normal closing process time in this video. http://www.realtor.org/videos/hud-1-going-away-understand-new-closing-forms-procedures There is much more to the upcoming changes, for more detailed information contact me, Fletcher Wilcox, at FWilcox@gcta.com or 602.648.1230. I will be representing Grand Canyon Title Agency in meeting with real estate designated brokers and their agents, and builders, and banks and lenders and their loan officers. Don’t wait to learn about the changes, but find out what you need to know, what you need to do.      

Disclaimer While deemed accurate this report does not guarantee the accuracy of the data. Some numbers will change. Report may not reflect all real estate activity. Information should be verified. This article is of a general nature, and is not intended as investment advice, real estate advice, lending advice or legal advice. Please consult your broker, your lender, your own independent legal counsel, your certified public accountant. The information in this report may not be the opinion of Grand Canyon Title Agency. Note: Included in some of the charts of this report may be a small number of new home sales and listings.  Below is the full report.

Download (PDF, Unknown)

Phoenix Real Estate: Find out how the new mortgage rules August 1, change residential real estate closings

Don’t miss this event. I want to invite you to an event on the effect new rules will have on how real estate transactions will close. The new rules which begin on August 1, 2015 apply to most residential real estate transactions in which the buyer is buying with a loan. Don’t wait to learn.

Find out about the new upcoming rules from our panel:

Jim Sexton President of the Arizona Association of REALTORs and designated broker at Realty ONE Group

Chris Mozilo V.P. Quality Control & Compliance for Homeowners Financial Group

Leslie Banes Certified Senior Escrow Officer, First American Title

Moderator:  Eric Wright Senior Loan Officer with AmeriFirst Financial

Moderator: Fletcher Wilcox  V.P. Grand Canyon Title Agency of FNTA, FNTA is a subsidiary of the Fortune 500 company FNF.

Wednesday, March 18 Be the first to know and prepared on how the rules change for residential real estate

• Five things every real estate agent, every loan officer and every escrow officer must know that happen August 1, 2015!

• Did you know the Good Faith Estimate and the HUD-1 Settlement Statement go away?

• What changes for buyers and sellers • What type of residential transactions are covered under the new rules

* What the National Association of REALTORs says about adding fifteen days to your normal close of escrow time

• We will review the upcoming TILA-RESPA Integrated Disclosure Changes

• We will define the new TILA-RESPA terms • Documents

– We will review the new loan estimate and the new closing disclosure • Timelines – you must understand the new timelines for closing residential real estate

Register today at the Arizona Mortgage Lenders Association Wednesday, March 18

  • Orange Tree Golf Resort 10601 N 56th St, Scottsdale 85254 8:30am – Hot Breakfast 9:00 – 11:00am – Panel Discussion

Thanks to our Sponsor Cost — AMLA Member $35.00 AMLA Loan Officer and REALTOR guest  — $55.00 REALTORS pay the member price of $35

Phoenix Real Estate: 2014 Single Family Real Estate Trends

February 25, 2015

Download (PDF, Unknown)

Existing Single Family Sales Go Up at End of Year. Mortgage Purchases Increasing.

  • December 2014 existing single family sales ten percent higher than December 2013
  •  Overall sales were less in 2014 than 2013, but trending upward
  • Watch listings: 2014 new monthly listings less than 2013  
  •  Median sale price in December highest month in 2014
  •  Sale Volume $160,000,000 higher in December 2014 than December 2013
  • 2014 Distressed Property Index lowest since 2006
  •  2014 cash purchases lowest since 2008
  • More purchases with a mortgage in 2014 than 2013
  • Grand Canyon Title acquired by Fortune 500 Company. See page two.
  • Big changes coming to residential real estate closing process starting on August 1, 2015. See page seven.

This report covers existing single family property sales in Greater Phoenix. Greater Phoenix is defined as Maricopa County. The data in this report, unless otherwise mentioned, is from the Arizona Regional Multiple Listing Services, Inc., also known as ARMLS.

In this report we compare performance for sales, sales volume, cash purchases, mortgage purchases, and new monthly listings. The report includes the Distressed Property Index covering foreclosure starts, auctioned properties, lender owned sales and short sales for the last twelve years. Most of the comparisons are year-over-year, comparing a time period in 2014 to the same time period in 2013.  Year-over-year comparisons are an effective way to measure performance, highlight differences, and negates the effect of seasonality.

GCTA_logo

On January 1, 2015 Grand Canyon Title Agency was acquired by a Fortune 500 company. Grand Canyon Title became a division of Fidelity National Title Agency (FNTA). FNTA is a subsidiary of Fidelity National Financial (FNF). FNF is ranked 316 on the Fortune 500.

http://fortune.com/fortune500/fidelity-national-financial-inc-316/

FNF has more claim reserves than any other company in the industry.  With more than a billion dollars in claim reserves to protect you, contact me to open your next commercial real estate transaction.  

http://fidelitydfw.com/page/Financial-Strength.aspx

Existing Single Family Sales and Sale Volume

 Sales were dismal for much of 2014. There were 6,563 less existing single family sales in the first three quarters of 2014 compared to 2013. Then the course reversed. In December 2014, there were 420 or ten percent more sales and $160,000,000 more in sale volume than in December 2013. These numbers made December 2014, on a year-to-year basis, the best month of 2014. Sale volume in the first eight months of 2014 was less than for the same months in 2013.

Not only were December 2014 existing sales higher than December 2013, but so were purchases with conventional, FHA and VA loans!

Distressed Property Index

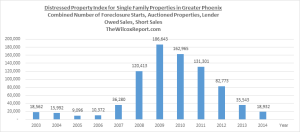
Disappearing cheap distressed property for sale was a reason for less sales in 2014. According to the Arizona Regional Multiple Listing Services, Inc. (ARMLS), there were 2,149 less lender owned sales and 4,934 less short sales in 2014 compared to 2013. The Distressed Property Index in 2009 was 186,643 compared to 18,932 in 2014 for a decrease of 90%. However, the disappearance of cheap sales diminished cash sales. Cash sales were less every month in 2014 compared to 2013, resulting in 7,370 less cash purchases in 2014. Cash sales in 2014 were the lowest since 2008.

Sales under $50,000

Gone are the days when there were thousands of sales under $50,000. In 2014, there were 207 existing single family sales under $50,000 compared to 625 in 2014. From 2009 through 2013 there were 22,513 sales under $50,000. So the good news is that the glut of cheap distressed properties for sale that previously drove down home values are gone.

6,154 more sales in 2013 than 2014

7,368 more cash sales in 2013 than 2014

1,214 more sales with a mortgage in 2014 than 2013

On August 1, 2015 new rules apply to residential real estate closings.

Do you know what they are?

On August 1, 2015 new rules apply to most closed-end consumer mortgages. The rules effect existing and new home purchases, refinances, loans secured by vacant land, construction only loans, and timeshare loans. Excluded are reverse mortgages, home equity lines of credit, mortgages secured by a mobile home or a dwelling that is not attached to real property.

The Consumer Financial Protection Bureau or the CFPB a creation of the Dodd-Frank Act, has integrated mortgage disclosures and created new forms. For loans originated on August 1, 2015 or later, the Good Faith Estimate and the Truth in Lending will be replaced with a new document called the Loan Estimate. And the final Truth in Lending and Settlement Statement are replaced with a new document called the Closing Disclosure.

How will this affect the closing of real estate transactions? The timing of workflow and closings will be impacted by the new rules. The Closing Disclosure has new time tables associated with it. There is a Delivery Period and a Waiting Period before the borrower is allowed to sign loan documents.

Ken Trepeta, Government Affairs for the National Association of REALTORS suggests adding fifteen more days to the normal closing process time in this video.

http://www.realtor.org/videos/hud-1-going-away-understand-new-closing-forms-procedures

There is much more to the upcoming changes, for more detailed information contact me, Fletcher Wilcox, at FWilcox@gcta.com or 602.648.1230. I will be representing Grand Canyon Title Agency in meeting with real estate designated brokers and their agents, and builders, and banks and lenders and their loan officers. Don’t wait to learn about the changes, but find out what you need to know, what you need to do, and how the changes impact your clients.      

Number of Buyers Purchasing with a Loan Improves. Fourth Quarter 2014 Best Quarter Year-To-Year

Purchases with a mortgage were 4.7% less in the first quarter of 2014 compared to the first quarter of 2013. As the year went on mortgage purchases gained momentum. In 2014, mortgage purchases up 1.3% in the second quarter, up 5.8% in the third quarter, and up 9.5% in the fourth quarter compared to the same quarters in 2013. However, the increase in mortgage purchases in the second and third quarters of 2014 was not enough to overcome the decrease in cash purchases resulting in less sales.

Segmenting Mortgages into Three Categories: Conventional, FHA and VA Loans

When segmenting mortgage purchases by conventional loans, FHA loans, and VA loans, we find the following results: Year-to-year conventional loan purchases were down the first three quarters in 2014 compared to 2013. A likely, partial reason for the decrease in conventional loans was the implementation of the new Dodd-Frank mortgage rules effective on January 10, 2014.

FHA loans were less only in the first quarter of 2014 compared to 2013, and VA loans were a hero all year long in 2014, up ever quarter of 2014 over 2013.

Keep Your Eye on Listing Inventory

The chart below is for new monthly listings of existing single properties in Greater Phoenix. The chart does not represent the total number of existing single family listings, but only new monthly listings. New monthly listings in 2014 were less from June through December compared to 2013.

Fletcher R. Wilcox

Fwilcox@GCTA.com  602.648.1230

Author of  TheWilcoxReport.com(TM)

GCTA_logo

Phoenix real estate market is coming back, report says. Will Phoenix real estate in 2015 be a buyer or seller real estate market?

http://roselawgroupreporter.com/2015/01/phoenix-housing-market-coming-back-report-says/?utm_source=The+Dealmaker+by+Belfiore+and+Rose+Law+Group&utm_campaign=2f82789d80-1_28_15_Dealmaker&utm_medium=email&utm_term=0_6de1c69ebc-2f82789d80-32164057

Phoenix housing market is coming back, report says

Posted by   /  January 27, 2015  /  No Comments

Wilcox graph

By Philip Haldiman, Editor-in-Chief | The Dealmaker

The Phoenix housing market has moved into recovery mode, according to a new report on single-family home sales, mortgage lending and job growth trends.

Arizona real estate analyst Fletcher Wilcox, author of the report, told The Dealmaker that while there is still pain in the local housing market, it’s now bouncing back because distressed properties have declined greatly, preventing home values from sky-rocking downward.

Another important factor is job growth in metropolitan Phoenix, he said.

“While job growth is lower than it has been historically — around two percent compared to four percent — greater Phoenix has gained back about 70 percent of jobs that were lost,” Wilcox said. “For the housing market to grow there has to be jobs.”

In greater Phoenix in 2009, 186,643 single-family properties either went into foreclosure, were auctioned, were sold as lender-owned properties or were short sales, Wilcox said.

Last year that number was 18,932, a 90 percent decrease.

The 2014 Distressed Property Index, which includes foreclosures, auctions, lender-owned properties and short sales, is now the lowest since 2006, Wilcox said.

“(Home values) have appreciated from the low point in August 2011,” he said. “Back then the median sale price for a single family property was $120,000.  In December 2014, the median sale price was $222,000.”

Highlights from 2014, Maricopa County

  • Foreclosure returned to 2005 levels.
  • Auctioned properties returned to 2003 levels.
  • Lowest lender-owned sales since 2007.
  • Lowest number of short sales since 2008.

(Source: ARMLS, compiled by Wilcox Report)  Posted by   /  January 27, 2015

Will 2015 be a buyers or sellers real estate market?  Stay tuned for the next report on the decrease in new listing inventory and the increase in mortgage purchases.

Fletcher Wilcox

Phoenix Real Estate: Sales, Sales Volume, Mortgages up in October 2014. Distressed Properties Down

Below are charts and graphs from the October 2014 TheWilcoxReport.com

  • October 2014 existing sales slightly higher than October 2013.
  • October 2014 sales volume $42,095,372 higher than October 2013.
  • October 2014 Distressed Property Index at 1,483 compared to 14,889 in October 2009.
  • October 2014 new monthly listings were 1,016 less than October 2013.

In this report we compare performance for sales, sales volume, cash purchases, mortgage purchases, and new monthly listings. The comparisons are year-over-year, comparing a time period in 2014 to the same time period in 2013. Year-over-year comparisons are an effective way to measure performance, highlight differences, and negates the effect of seasonality.

Download (DOCX, 120KB)

Download (DOCX, 28KB)