Phoenix Real Estate: 2014 Single Family Real Estate Trends

February 25, 2015

Download (PDF, Unknown)

Existing Single Family Sales Go Up at End of Year. Mortgage Purchases Increasing.

  • December 2014 existing single family sales ten percent higher than December 2013
  •  Overall sales were less in 2014 than 2013, but trending upward
  • Watch listings: 2014 new monthly listings less than 2013  
  •  Median sale price in December highest month in 2014
  •  Sale Volume $160,000,000 higher in December 2014 than December 2013
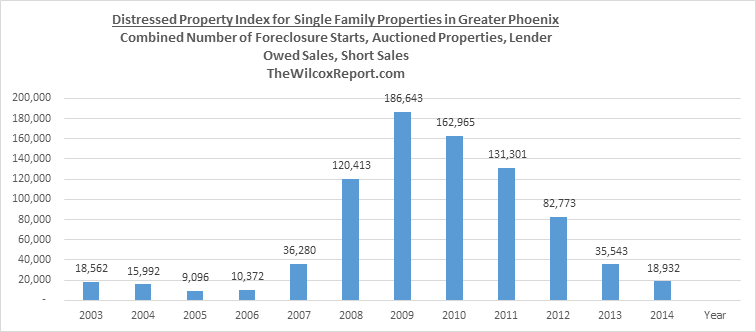
  • 2014 Distressed Property Index lowest since 2006
  •  2014 cash purchases lowest since 2008
  • More purchases with a mortgage in 2014 than 2013
  • Grand Canyon Title acquired by Fortune 500 Company. See page two.
  • Big changes coming to residential real estate closing process starting on August 1, 2015. See page seven.

This report covers existing single family property sales in Greater Phoenix. Greater Phoenix is defined as Maricopa County. The data in this report, unless otherwise mentioned, is from the Arizona Regional Multiple Listing Services, Inc., also known as ARMLS.

In this report we compare performance for sales, sales volume, cash purchases, mortgage purchases, and new monthly listings. The report includes the Distressed Property Index covering foreclosure starts, auctioned properties, lender owned sales and short sales for the last twelve years. Most of the comparisons are year-over-year, comparing a time period in 2014 to the same time period in 2013.  Year-over-year comparisons are an effective way to measure performance, highlight differences, and negates the effect of seasonality.

GCTA_logo

On January 1, 2015 Grand Canyon Title Agency was acquired by a Fortune 500 company. Grand Canyon Title became a division of Fidelity National Title Agency (FNTA). FNTA is a subsidiary of Fidelity National Financial (FNF). FNF is ranked 316 on the Fortune 500.

http://fortune.com/fortune500/fidelity-national-financial-inc-316/

FNF has more claim reserves than any other company in the industry.  With more than a billion dollars in claim reserves to protect you, contact me to open your next commercial real estate transaction.  

http://fidelitydfw.com/page/Financial-Strength.aspx

Existing Single Family Sales and Sale Volume

 Sales were dismal for much of 2014. There were 6,563 less existing single family sales in the first three quarters of 2014 compared to 2013. Then the course reversed. In December 2014, there were 420 or ten percent more sales and $160,000,000 more in sale volume than in December 2013. These numbers made December 2014, on a year-to-year basis, the best month of 2014. Sale volume in the first eight months of 2014 was less than for the same months in 2013.

Not only were December 2014 existing sales higher than December 2013, but so were purchases with conventional, FHA and VA loans!

Distressed Property Index

Disappearing cheap distressed property for sale was a reason for less sales in 2014. According to the Arizona Regional Multiple Listing Services, Inc. (ARMLS), there were 2,149 less lender owned sales and 4,934 less short sales in 2014 compared to 2013. The Distressed Property Index in 2009 was 186,643 compared to 18,932 in 2014 for a decrease of 90%. However, the disappearance of cheap sales diminished cash sales. Cash sales were less every month in 2014 compared to 2013, resulting in 7,370 less cash purchases in 2014. Cash sales in 2014 were the lowest since 2008.

Sales under $50,000

Gone are the days when there were thousands of sales under $50,000. In 2014, there were 207 existing single family sales under $50,000 compared to 625 in 2014. From 2009 through 2013 there were 22,513 sales under $50,000. So the good news is that the glut of cheap distressed properties for sale that previously drove down home values are gone.

6,154 more sales in 2013 than 2014

7,368 more cash sales in 2013 than 2014

1,214 more sales with a mortgage in 2014 than 2013

On August 1, 2015 new rules apply to residential real estate closings.

Do you know what they are?

On August 1, 2015 new rules apply to most closed-end consumer mortgages. The rules effect existing and new home purchases, refinances, loans secured by vacant land, construction only loans, and timeshare loans. Excluded are reverse mortgages, home equity lines of credit, mortgages secured by a mobile home or a dwelling that is not attached to real property.

The Consumer Financial Protection Bureau or the CFPB a creation of the Dodd-Frank Act, has integrated mortgage disclosures and created new forms. For loans originated on August 1, 2015 or later, the Good Faith Estimate and the Truth in Lending will be replaced with a new document called the Loan Estimate. And the final Truth in Lending and Settlement Statement are replaced with a new document called the Closing Disclosure.

How will this affect the closing of real estate transactions? The timing of workflow and closings will be impacted by the new rules. The Closing Disclosure has new time tables associated with it. There is a Delivery Period and a Waiting Period before the borrower is allowed to sign loan documents.

Ken Trepeta, Government Affairs for the National Association of REALTORS suggests adding fifteen more days to the normal closing process time in this video.

http://www.realtor.org/videos/hud-1-going-away-understand-new-closing-forms-procedures

There is much more to the upcoming changes, for more detailed information contact me, Fletcher Wilcox, at FWilcox@gcta.com or 602.648.1230. I will be representing Grand Canyon Title Agency in meeting with real estate designated brokers and their agents, and builders, and banks and lenders and their loan officers. Don’t wait to learn about the changes, but find out what you need to know, what you need to do, and how the changes impact your clients.      

Number of Buyers Purchasing with a Loan Improves. Fourth Quarter 2014 Best Quarter Year-To-Year

Purchases with a mortgage were 4.7% less in the first quarter of 2014 compared to the first quarter of 2013. As the year went on mortgage purchases gained momentum. In 2014, mortgage purchases up 1.3% in the second quarter, up 5.8% in the third quarter, and up 9.5% in the fourth quarter compared to the same quarters in 2013. However, the increase in mortgage purchases in the second and third quarters of 2014 was not enough to overcome the decrease in cash purchases resulting in less sales.

Segmenting Mortgages into Three Categories: Conventional, FHA and VA Loans

When segmenting mortgage purchases by conventional loans, FHA loans, and VA loans, we find the following results: Year-to-year conventional loan purchases were down the first three quarters in 2014 compared to 2013. A likely, partial reason for the decrease in conventional loans was the implementation of the new Dodd-Frank mortgage rules effective on January 10, 2014.

FHA loans were less only in the first quarter of 2014 compared to 2013, and VA loans were a hero all year long in 2014, up ever quarter of 2014 over 2013.

Keep Your Eye on Listing Inventory

The chart below is for new monthly listings of existing single properties in Greater Phoenix. The chart does not represent the total number of existing single family listings, but only new monthly listings. New monthly listings in 2014 were less from June through December compared to 2013.

Fletcher R. Wilcox

Fwilcox@GCTA.com  602.648.1230

Author of  TheWilcoxReport.com(TM)

GCTA_logo

Phoenix real estate market is coming back, report says. Will Phoenix real estate in 2015 be a buyer or seller real estate market?

http://roselawgroupreporter.com/2015/01/phoenix-housing-market-coming-back-report-says/?utm_source=The+Dealmaker+by+Belfiore+and+Rose+Law+Group&utm_campaign=2f82789d80-1_28_15_Dealmaker&utm_medium=email&utm_term=0_6de1c69ebc-2f82789d80-32164057

Phoenix housing market is coming back, report says

Posted by   /  January 27, 2015  /  No Comments

Wilcox graph

By Philip Haldiman, Editor-in-Chief | The Dealmaker

The Phoenix housing market has moved into recovery mode, according to a new report on single-family home sales, mortgage lending and job growth trends.

Arizona real estate analyst Fletcher Wilcox, author of the report, told The Dealmaker that while there is still pain in the local housing market, it’s now bouncing back because distressed properties have declined greatly, preventing home values from sky-rocking downward.

Another important factor is job growth in metropolitan Phoenix, he said.

“While job growth is lower than it has been historically — around two percent compared to four percent — greater Phoenix has gained back about 70 percent of jobs that were lost,” Wilcox said. “For the housing market to grow there has to be jobs.”

In greater Phoenix in 2009, 186,643 single-family properties either went into foreclosure, were auctioned, were sold as lender-owned properties or were short sales, Wilcox said.

Last year that number was 18,932, a 90 percent decrease.

The 2014 Distressed Property Index, which includes foreclosures, auctions, lender-owned properties and short sales, is now the lowest since 2006, Wilcox said.

“(Home values) have appreciated from the low point in August 2011,” he said. “Back then the median sale price for a single family property was $120,000.  In December 2014, the median sale price was $222,000.”

Highlights from 2014, Maricopa County

  • Foreclosure returned to 2005 levels.
  • Auctioned properties returned to 2003 levels.
  • Lowest lender-owned sales since 2007.
  • Lowest number of short sales since 2008.

(Source: ARMLS, compiled by Wilcox Report)  Posted by   /  January 27, 2015

Will 2015 be a buyers or sellers real estate market?  Stay tuned for the next report on the decrease in new listing inventory and the increase in mortgage purchases.

Fletcher Wilcox

Phoenix Real Estate: Explaining President Obama’s plan to stimulate home buyers with FHA Loans

Today, January 8, the President visited my alma mater, Central High School in Phoenix, Arizona.  He announced a plan to increase homeownership.  The Federal Housing Administration will change the FHA annual mortgage premium from 1.35% to .85%.  So, a future FHA mortgage payment will be cut by .5% or ½%.

Until FHA puts the change in writing, the annual mortgage premium stays at 1.35%.

The annual mortgage premium is mortgage insurance that a borrower pays for obtaining an FHA insured loan. The premiums are used as capital reserves for outstanding FHA mortgage guarantees.  There is also a one-time mortgage insurance fee a borrower pays when obtaining an FHA loan.  That fee stays the same.

The monthly saving for most borrowers purchasing a single family home in the Phoenix area would be $70 per month.

According to data obtained through the Arizona Multiple Listing Services, Inc., the median FHA mortgage amount for purchasing a single family home in December 2014 in Greater Phoenix was $168,000.  Below is table comparing a FHA loan of $168,000 with the old and new mortgage premiums.

I estimate this change will increase overall single family sales by 2%-5%.  Most likely at the lower end of this range.  This estimate assumes the change applies not only to first time homebuyers, but also boomerang buyers.

The change benefits buyers only in certain price ranges. The maximum FHA loan amount is $271,050 in Maricopa County.

Today’s announcement will increase buyer activity.  Media attention on the President’s plan will cause some potential buyers to contact real estate agents and lenders to find out more information.  This is a good thing.

This move most likely will stimulate the refinance market more than it does the  purchase market.  This is why: If a borrower’s current FHA interest rate is 4.0% and their monthly premium is 1.35% they are paying about 5.35% interest on their loan. (It does not quite work out to the aforementioned but is close enough for an example).  If a borrower refinances to an FHA interest rate of 3.5% and now their mortgage insurance premium is .85% they are now paying 4.35% on their loan or 1% less. Paying 1% less will encourage a mini FHA refinance boom.

Today’s cut of .50% in the annual premium will be muted if the mortgage interest rate goes up .50%.

There may be some opposition to today’s announcement. There was a reason for the premium to be 1.35%.   As mentioned earlier these premiums are used as capital reserves for outstanding FHA mortgage guarantees.

The last time the President was in Phoenix, August 2013, I was on channel 12 Brahm Resnick’s show Sunday Square Off  discussing the President and the Phoenix real estate recovery.

Loan amount $168,000 $168,000 Monthly saving Yearly saving
Annual mortgage insurance premium 1.35% .85%
Annual amount $2,268 $1,428
Monthly payment (annual amount divided by 12) $189 $119 $70 $840

(12 months x $70)


Gilbert Real Estate: Is it a Buyer Or Seller Market? An interview with Amy Golba. Also December 2014 real estate results for Gilbert, Mesa and Chandler.

In this edition of TheWilcoxReport.com I discuss with Amy Golba the state of real estate market in the Southeast Valley of Greater Phoenix and specifically Gilbert, Arizona.  Amy is the owner and designated broker of Century 21 Platinum Real Estate.  Amy and her agents spend a lot of time in the Southeast Valley markets of Gilbert, Mesa, Chandler and Ahwatukee.  Amy is also a principal in the Golba Group, which manages over a thousand single family property rentals.    This interview was conducted in November 2014.

Year-to-Year Comparison of Existing Single Family Sales for the month of December

Below the video is a comparison of December 2014 to December 2013 existing single family homes sales for Gilbert, Mesa, and Chandler.  Median sale prices were up in all three cities this December over last December.  Gilbert shined with 23% more sales, while Chandler sales were about the same.  Mesa sales were up 6%. The data is from the Arizona Regional Multiple Listing Services, Inc.


Sales Sales Median Sale Price
City Month 2013 2014 Change Change 2013 2014 Change Change
Gilbert December 306 377 71 23.2% $254,375 $256,000 $1,625 0.6%
Mesa December 466 495 29 6.2% $187,000 $192,000 $5,000 2.7%
Chandler December 292 290 -2 -0.7% $245,000 $258,000 $13,000 5.3%

Phoenix Real Estate: Sales, Sales Volume, Mortgages up in October 2014. Distressed Properties Down

Below are charts and graphs from the October 2014 TheWilcoxReport.com

  • October 2014 existing sales slightly higher than October 2013.
  • October 2014 sales volume $42,095,372 higher than October 2013.
  • October 2014 Distressed Property Index at 1,483 compared to 14,889 in October 2009.
  • October 2014 new monthly listings were 1,016 less than October 2013.

In this report we compare performance for sales, sales volume, cash purchases, mortgage purchases, and new monthly listings. The comparisons are year-over-year, comparing a time period in 2014 to the same time period in 2013. Year-over-year comparisons are an effective way to measure performance, highlight differences, and negates the effect of seasonality.

Download (DOCX, 120KB)

Download (DOCX, 28KB)


Phoenix Real Estate: Were September 2014 sales results a market quip or trend?

The September Surprise

September 2014 was best month year-over-year for existing single family sales, sales volume, and mortgage purchases

September brought some good news for sales, sales volume, and mortgage purchases. The existing single family housing market gained a little momentum. The information in this report analyzes existing single family home sales in Phoenix. The use of the term Phoenix is a general term for those cities located in Maricopa County. The information was compiled from the Arizona Regional Multiple Listing Service, Inc. (ARMLS).

To see full report go to https://gcta.com/wp-content/uploads/2014/10/September2014ExisitingHomeSalesforPhoenix-.pdf

In this report we compare performance for sales, sales volume, cash purchases, mortgage purchases, total active listings, new monthly listings and estimated months of supply. Most of the comparisons are year-over-year, comparing a time period in 2014 to the same time period in 2013. Year-over-year comparisons are an effective way to measure performance, highlight differences, and negates the effect of seasonality.  Are you ready?

Download (DOCX, 23KB)

Sales of Existing Single Family Homes. September 2014, was the first month this year in which there were more sales compared to the same month of last year. Well, the number of sales was small. There were 20 more sales. While 20 may not be much, it is a lot better than May 2014, when there were 1,360 less sales than the previous May. See Table One, page six.

Sales Volume. Better than the slight increase in September sales was a much larger increase in sales volume. Home appreciation over the last year, and the slight increase in sales made September the first month this year that the total dollar volume of sales was higher than for the same month of the previous year. Total sales volume in September 2014 was up 4% or $48,000,000 more than September 2014. In May 2014, the 1,360 less sales resulted in $310,000,000 less in sales volume. See Table Two, page six. Total sales volume is determined by adding up the number sales and their sale prices. The average (mean) sales price in September 2014 was $274,019 or $9,316 higher than September 2013. The median sales price this September was $216,900 or $5,000 higher than last September.  See Table Three, page seven.

Cash Purchases and Mortgage Purchases. Purchases with cash continues to decline. They are down every month year-over-year. There were 968 in August and 959 in September. The last month that there were less than 1,000 monthly cash purchases was almost six years ago, in November 2008, when there were 894 cash purchases.

Less cash purchases should be no surprise. Investors make up the majority of cash purchases. Investors want to buy cheap. Most cheap sales are distressed sales. The number of distressed properties for sale is down considerable from the flood a few years ago. In the month of September 2010, 14,301 properties fit into one of these four distressed categories: foreclosure start, auctioned property, lender owned sale or short sale. In September 2014, only 1,535 or 12,766 less properties than September 2010 were in one of these four categories.

In the first quarter of 2014, sales were not only down because of less cash purchases, but also because there were less mortgage purchases. There were 2,207 less cash purchases, 354 less conventional loan purchases, 197 less FHA loan purchases, but 119 more VA loan purchases in the first quarter of 2014. See Table Seven, page ten.

Thus, the media reports of a flamed out Phoenix real estate recovery. But something changed. The mortgage purchase market gained vigor. September 2014, was the fourth consecutive month year-over-year there were more mortgage purchases. For the months June through September, there were 719 more FHA purchases, 303 more VA purchases, 56 more conventional loan purchases, while there were 2,807 less cash purchases. See Table Eight, page 10.

Conclusion and Prediction

When segmenting the single family market into cash versus mortgage purchases, it should be no surprise that cash purchases are decreasing and mortgage purchases increasing. As the residential market recovers, there will be less foreclosures and short sales available for cash investors to buy. And as the number of jobs, population and eligible boomerang buyers continues to increase, mortgage purchases should increase. While job growth and population growth are slower than hoped for, they are still positive. As to boomerang buyers, their numbers increase every day. Every day more of them have met the FHA three year wait period to buy again after a foreclosure or short sale.

So, were this September’s year-over-year increase in sales, total sales volume and mortgage purchases a quip or trend?

Table Seven year-over-year results for June through May shows that the number of conventional loans purchases about even, but FHA loan purchases up 16% and VA purchases up 4%. Early October 2014 numbers support sales at the same pace as October 2013. The numbers mirror September results in that they show a year-over-year decrease in cash purchases and an increase in mortgage purchases. The momentum of the mortgage purchase market should make the last quarter of 2014 the best quarter year-over-year in 2014 for home sales and total sales volume. Excluding of course some unforeseen economic event or other crisis.

I go with September 2014 results as part of a positive housing trend and not a quip or blip.

An interview with National Fox Business News Host Gerri Willis on Phoenix real estate.

Gerri Willis of the Willis Report In May 2014, said things may be cooling off in the Phoenix real estate market because cash deals were down. My response to this cooling off and less cash deals is because our market is normalizing. Normalizing in that the market is becoming more of a mortgage purchase market, and less of a cash purchase market because the foreclosure crisis is over.

https://www.youtube.com/watch?v=4WkUe7KhfGU