Phoenix real estate market is coming back, report says. Will Phoenix real estate in 2015 be a buyer or seller real estate market?

http://roselawgroupreporter.com/2015/01/phoenix-housing-market-coming-back-report-says/?utm_source=The+Dealmaker+by+Belfiore+and+Rose+Law+Group&utm_campaign=2f82789d80-1_28_15_Dealmaker&utm_medium=email&utm_term=0_6de1c69ebc-2f82789d80-32164057

Phoenix housing market is coming back, report says

Posted by   /  January 27, 2015  /  No Comments

Wilcox graph

By Philip Haldiman, Editor-in-Chief | The Dealmaker

The Phoenix housing market has moved into recovery mode, according to a new report on single-family home sales, mortgage lending and job growth trends.

Arizona real estate analyst Fletcher Wilcox, author of the report, told The Dealmaker that while there is still pain in the local housing market, it’s now bouncing back because distressed properties have declined greatly, preventing home values from sky-rocking downward.

Another important factor is job growth in metropolitan Phoenix, he said.

“While job growth is lower than it has been historically — around two percent compared to four percent — greater Phoenix has gained back about 70 percent of jobs that were lost,” Wilcox said. “For the housing market to grow there has to be jobs.”

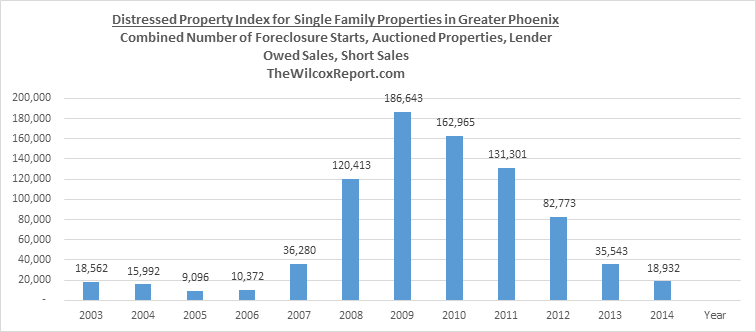
In greater Phoenix in 2009, 186,643 single-family properties either went into foreclosure, were auctioned, were sold as lender-owned properties or were short sales, Wilcox said.

Last year that number was 18,932, a 90 percent decrease.

The 2014 Distressed Property Index, which includes foreclosures, auctions, lender-owned properties and short sales, is now the lowest since 2006, Wilcox said.

“(Home values) have appreciated from the low point in August 2011,” he said. “Back then the median sale price for a single family property was $120,000.  In December 2014, the median sale price was $222,000.”

Highlights from 2014, Maricopa County

  • Foreclosure returned to 2005 levels.
  • Auctioned properties returned to 2003 levels.
  • Lowest lender-owned sales since 2007.
  • Lowest number of short sales since 2008.

(Source: ARMLS, compiled by Wilcox Report)  Posted by   /  January 27, 2015

Will 2015 be a buyers or sellers real estate market?  Stay tuned for the next report on the decrease in new listing inventory and the increase in mortgage purchases.

Fletcher Wilcox

Phoenix Real Estate: Sales, Sales Volume, Mortgages up in October 2014. Distressed Properties Down

Below are charts and graphs from the October 2014 TheWilcoxReport.com

  • October 2014 existing sales slightly higher than October 2013.
  • October 2014 sales volume $42,095,372 higher than October 2013.
  • October 2014 Distressed Property Index at 1,483 compared to 14,889 in October 2009.
  • October 2014 new monthly listings were 1,016 less than October 2013.

In this report we compare performance for sales, sales volume, cash purchases, mortgage purchases, and new monthly listings. The comparisons are year-over-year, comparing a time period in 2014 to the same time period in 2013. Year-over-year comparisons are an effective way to measure performance, highlight differences, and negates the effect of seasonality.

Download (DOCX, 120KB)

Download (DOCX, 28KB)


Phoenix Real Estate: Were September 2014 sales results a market quip or trend?

The September Surprise

September 2014 was best month year-over-year for existing single family sales, sales volume, and mortgage purchases

September brought some good news for sales, sales volume, and mortgage purchases. The existing single family housing market gained a little momentum. The information in this report analyzes existing single family home sales in Phoenix. The use of the term Phoenix is a general term for those cities located in Maricopa County. The information was compiled from the Arizona Regional Multiple Listing Service, Inc. (ARMLS).

To see full report go to https://gcta.com/wp-content/uploads/2014/10/September2014ExisitingHomeSalesforPhoenix-.pdf

In this report we compare performance for sales, sales volume, cash purchases, mortgage purchases, total active listings, new monthly listings and estimated months of supply. Most of the comparisons are year-over-year, comparing a time period in 2014 to the same time period in 2013. Year-over-year comparisons are an effective way to measure performance, highlight differences, and negates the effect of seasonality.  Are you ready?

Download (DOCX, 23KB)

Sales of Existing Single Family Homes. September 2014, was the first month this year in which there were more sales compared to the same month of last year. Well, the number of sales was small. There were 20 more sales. While 20 may not be much, it is a lot better than May 2014, when there were 1,360 less sales than the previous May. See Table One, page six.

Sales Volume. Better than the slight increase in September sales was a much larger increase in sales volume. Home appreciation over the last year, and the slight increase in sales made September the first month this year that the total dollar volume of sales was higher than for the same month of the previous year. Total sales volume in September 2014 was up 4% or $48,000,000 more than September 2014. In May 2014, the 1,360 less sales resulted in $310,000,000 less in sales volume. See Table Two, page six. Total sales volume is determined by adding up the number sales and their sale prices. The average (mean) sales price in September 2014 was $274,019 or $9,316 higher than September 2013. The median sales price this September was $216,900 or $5,000 higher than last September.  See Table Three, page seven.

Cash Purchases and Mortgage Purchases. Purchases with cash continues to decline. They are down every month year-over-year. There were 968 in August and 959 in September. The last month that there were less than 1,000 monthly cash purchases was almost six years ago, in November 2008, when there were 894 cash purchases.

Less cash purchases should be no surprise. Investors make up the majority of cash purchases. Investors want to buy cheap. Most cheap sales are distressed sales. The number of distressed properties for sale is down considerable from the flood a few years ago. In the month of September 2010, 14,301 properties fit into one of these four distressed categories: foreclosure start, auctioned property, lender owned sale or short sale. In September 2014, only 1,535 or 12,766 less properties than September 2010 were in one of these four categories.

In the first quarter of 2014, sales were not only down because of less cash purchases, but also because there were less mortgage purchases. There were 2,207 less cash purchases, 354 less conventional loan purchases, 197 less FHA loan purchases, but 119 more VA loan purchases in the first quarter of 2014. See Table Seven, page ten.

Thus, the media reports of a flamed out Phoenix real estate recovery. But something changed. The mortgage purchase market gained vigor. September 2014, was the fourth consecutive month year-over-year there were more mortgage purchases. For the months June through September, there were 719 more FHA purchases, 303 more VA purchases, 56 more conventional loan purchases, while there were 2,807 less cash purchases. See Table Eight, page 10.

Conclusion and Prediction

When segmenting the single family market into cash versus mortgage purchases, it should be no surprise that cash purchases are decreasing and mortgage purchases increasing. As the residential market recovers, there will be less foreclosures and short sales available for cash investors to buy. And as the number of jobs, population and eligible boomerang buyers continues to increase, mortgage purchases should increase. While job growth and population growth are slower than hoped for, they are still positive. As to boomerang buyers, their numbers increase every day. Every day more of them have met the FHA three year wait period to buy again after a foreclosure or short sale.

So, were this September’s year-over-year increase in sales, total sales volume and mortgage purchases a quip or trend?

Table Seven year-over-year results for June through May shows that the number of conventional loans purchases about even, but FHA loan purchases up 16% and VA purchases up 4%. Early October 2014 numbers support sales at the same pace as October 2013. The numbers mirror September results in that they show a year-over-year decrease in cash purchases and an increase in mortgage purchases. The momentum of the mortgage purchase market should make the last quarter of 2014 the best quarter year-over-year in 2014 for home sales and total sales volume. Excluding of course some unforeseen economic event or other crisis.

I go with September 2014 results as part of a positive housing trend and not a quip or blip.

An interview with National Fox Business News Host Gerri Willis on Phoenix real estate.

Gerri Willis of the Willis Report In May 2014, said things may be cooling off in the Phoenix real estate market because cash deals were down. My response to this cooling off and less cash deals is because our market is normalizing. Normalizing in that the market is becoming more of a mortgage purchase market, and less of a cash purchase market because the foreclosure crisis is over.

https://www.youtube.com/watch?v=4WkUe7KhfGU

Scottsdale Real Estate: Retiring or thinking about retirement in Scottsdale. The coming silver tsunami likely to bring many retirees to Scottsdale.

Here Comes the Silver Tsunami.

In 2010 there were 40 million people in the U.S. that were sixty-five or older according to the Adminstration on Aging, a division within the U.S. Department of Health and Human Services. This number is projected to grow to 54 million in 2020 and 72 million by 2030. Some of those sixty-five or older will retire. And often what comes with retirement is a move. The move be downsizing into a smaller home with less maintenance and/or moving to a state with a warmer climate such as Scottsdale, Arizona.

CNN Money in 2013 rated Scottsdale as one of the best eight small cities for retirement if you had a nest egg.

Recently, on TheWilcoxReport.com I interviewed Kerri Calidora of Ventana Fine Properties located in Scottsdale. One of her real estate specialties is working with sellers who are retiring or will be, and who want to downsize their home. She has a team of downsizers to help those making this transition. She has ideas on attractively presenting a property and all its features. Also, she is familiar with retirement communities in Scottsdale. She says often when someone is coming up to eighty years of age they may prefer one of Scottsdale’s retirement communities. And as Director of Relocation at Ventana Fine Properties, she helps buyers in finding homes that are relocating to Scottsdale.

Kerri may be contacted at KerriC@VentanaFineProperties.com or 480-236-3087.

Scottsdale Real Estate: Is it a Buyer or Seller Market? Fletcher Wilcox interviews Shawn Shackelton of Ventana Fine Properties

Shawn Shackelton answers the question “Is the Scottsdale real estate market a buyer market or a seller market? Shawn gives tips if you are a seller thinking of selling your home.  Shawn has been in real estate for seventeen years.  She works at Ventana Fine Properties in Scottsdale.  Before Ventana, she spent ten years working in the upscale luxury community of Silverleaf in Scottsdale.

Below are pictures of two of her Scottsdale luxury home listings.  The first is 9899 E. Buteo Drive, Scottsdale 85255.  This luxury home is 4,949 square feet and priced at $1,950,000.

Download (DOCX, 612KB)

The second is a luxury condo listing located at The Mark in Old Town Scottsdale.  The Mark is located at 6803 E. Main Street, number 2211, Scottsdale 85251  It is 2,444 square feet and is priced at

Download (DOCX, 452KB)


VA loans or mortgages grow in importance for Phoenix real estate market: Overall sales are down, but surging are sales with VA loans.

While the number of sales of single family existing homes in Greater Phoenix have been down every month this year compared to the same month of last year, not so when it comes to sales involving VA loans.  The number of sales in which a buyer financed the purchase with a VA loan or VA mortgage is up every month this year compared to the same month as last year.  See Chart One below.  In fact, VA loans were 7.2% of all sales of single family existing homes for the first half of 2014 in Greater Phoenix.  The percentage of 7.2% has not been higher this century.  In 2013 the percentage was 5.2% and was 4.1% in 2012.  See Chart Two.

The United States Department of Veteran Affairs, shows the veteran population in Arizona at 527,400 as of September 30, 2013.   A veteran may purchases a home with no down payment up to a $417,000 purchase price.  According to the Arizona Regional Multiple Listing Services, Inc. (ARMLS), for the first six months of 2014, there were 2,098 single family existing homes purchased with a VA loan.  Ninety-nine of these sales had purchase prices over $417,000.   The highest purchases price this year with a VA loan was in Scottsdale, Arizona.  The purchase price was $1,000,000.  I spoke with the selling agent Lyn Trayte with Dominic and Co. International Real Estate.  She said the buyer was a retired veteran and the transaction went smoothly.

Demand for VA loans up as other mortgages fall  an article by Catherine Reagor from the Arizona Republic.

If you need a referral for a lender who knows VA loans contact me at FWilcox@gcta.com or 602-648-1230                                                                                

Table One:  Number of Purchases with a VA Loan for Single Family Existing Properties in Greater PhoenixVA loans1


2013 2014 Difference
January 209 245 +36
February 257 282 +25
March 321 379 +58
April 317 365 +48
May 348 402 +54
June 319 425 +106
July 359 388 +29

Table Two:  Percentage of Overall Purchases with a VA Loan 

January 1 through June 30 for 2000 through 2014 

VA Loan Percent

Fletcher R. Wilcox

V.P. Business Development, Real Estate Analyst

Grand Canyon Title Agency, Inc.

FWilcox@gcta.com   602-648-1230